
Figure 11.
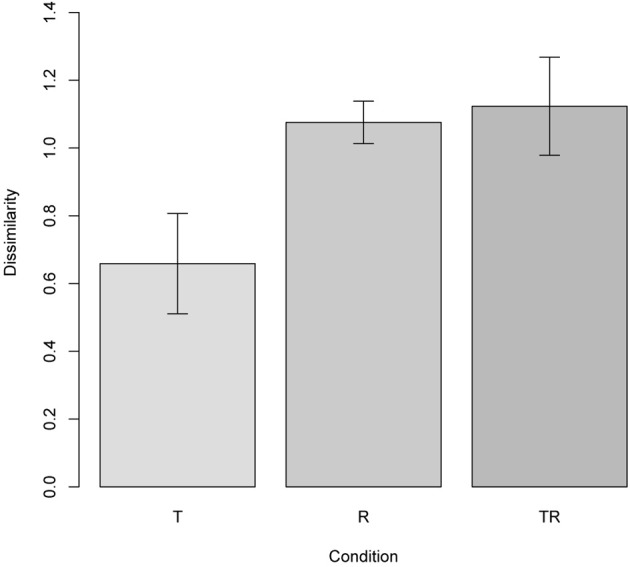
Experiment 3, sensitivity to qualitative change; see section 7.4. The plot shows the difference between two scenes (means with 95% confidence intervals), one of which has been generated from the other via three types of structural transformations: translation (T), reversal, or switching the two objects around (R), and both translation and reversal combined (TR). The results replicate those of the corresponding experiment in (Hayworth et al., 2011).