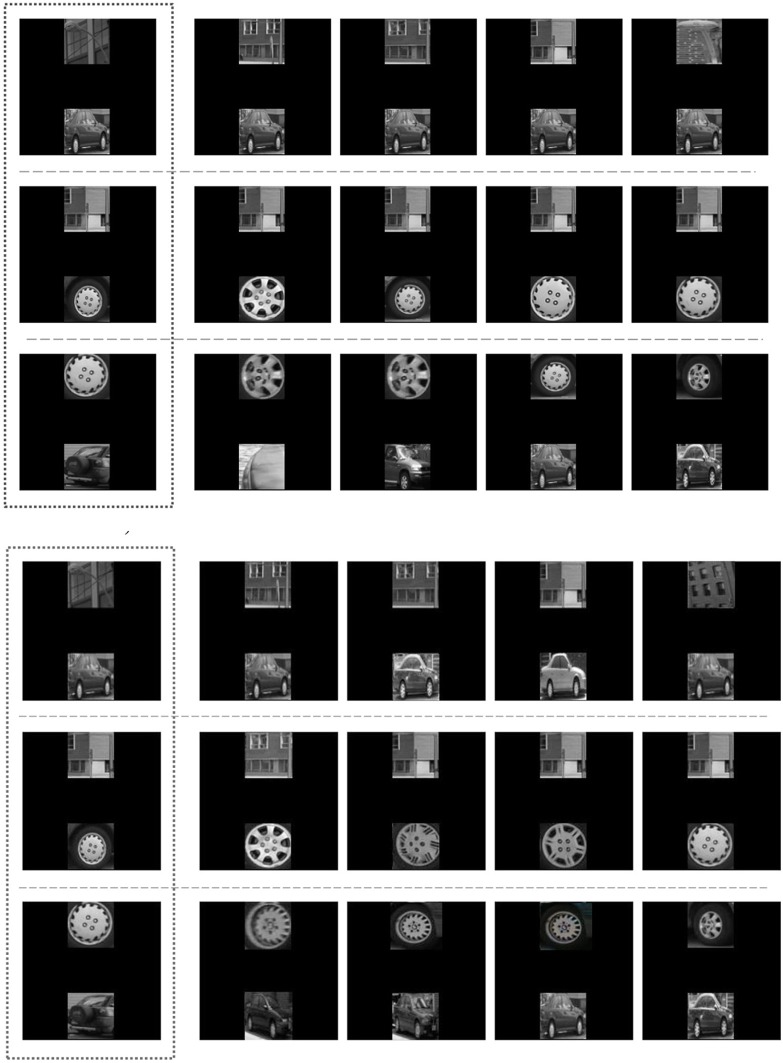
Figure 7.
Experiment 1, testing productivity. See section 7.2 for a description of the procedure and Figure 8 for quantitative results. Above: the performance of the ChoRD model, which uses CT to represent ROIs. The leftmost column shows test scenes; the other columns show the best five matches retrieved from the model's LSH table, in the decreasing order of similarity to the test scene. Top row: One novel object at position ROI1. Middle row: One novel object at position ROI2. Bottom row: Two novel objects. Below: the performance of a version of the model that uses raw ROI encoding rather than one based on CT (the layout was still encoded with CT).

