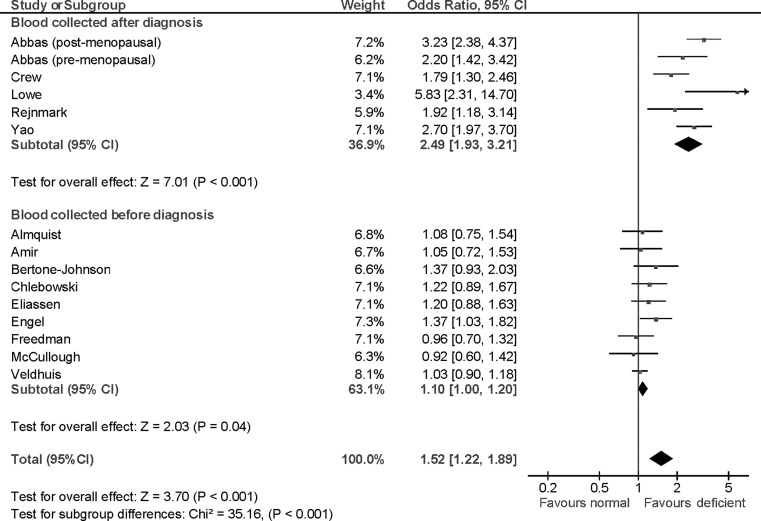
Fig. 3.
Forest plot of odds ratios for breast cancer risk comparing low to high blood levels of vitamin-D metabolites. Odds ratios for each study are represented by the squares, the size of the square represents the weight of the trial in the meta-analysis, and the horizontal line crossing the square represents the 95% confidence interval. The diamonds represent the estimated pooled effect based on each cohort individually (labeled sub-total) and for all cohorts together (labeled total). Test of subgroup differences relates to the test of heterogeneity between the two subgroups as defined by Deeks et al. [14]. All p values are two-sided

