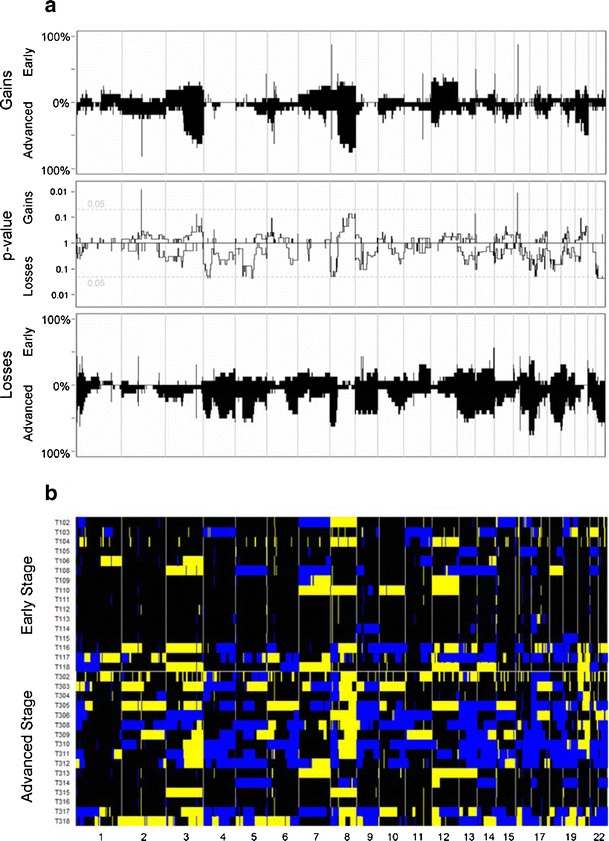
Fig. 1.

The frequencies of copy number gains in 16 early and 16 advanced stage ovarian cancer samples are plotted at the top of Panel A. The frequencies were tested for a difference between both stages and the false discovery rate corrected p-value is displayed. At the bottom of Panel A the analogue is shown for copy number losses. Panel B shows the array CGH profiles of all samples grouped per stage with blue indicating a loss, black a normal and yellow a gain in DNA copy number
