
Fig. 3.
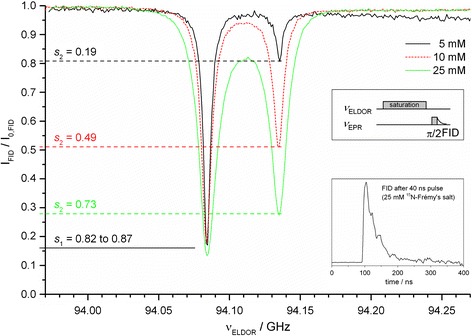
Normalized and baseline corrected EPR FID intensity of the hyperfine line at 94.08 GHz as a function of the ELDOR frequency, i.e. the frequency of the saturating pulse, and of different concentrations of 15N-labelled Frémy’s salt in aqueous solution at room temperature. The saturation levels of the individual EPR lines are indicated (the small deviations in s 1 for different samples are attributed to slightly altered coupling conditions in the microwave cavity leading to different quality factors and microwave B 1 field strengths at the sample position). Inset: with Frémy’s salt, the EPR FID is observable at 25 mM radical concentration