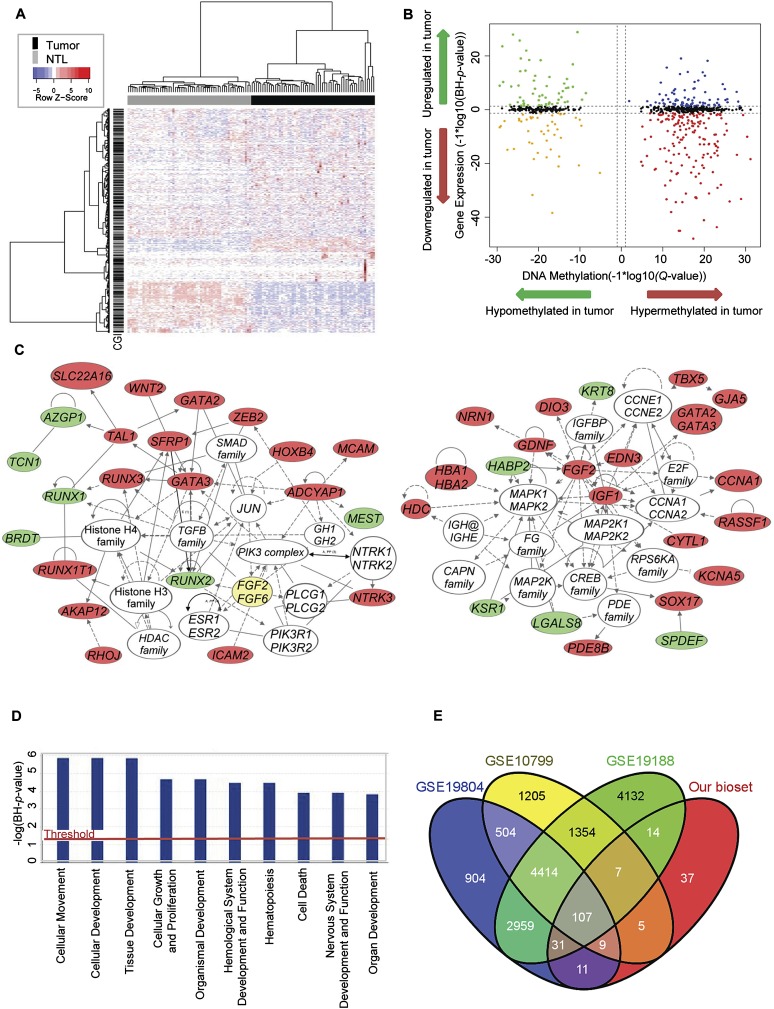
Figure 2.
Identification of genes showing coordinately changed DNA methylation and gene expression. (A) Two-dimensional hierarchical clustering with 1061 probes corresponding to 709 genes across all tumors (n = 58) and NTL (n = 58). Rows represent probes; columns are samples. (B) Starburst plot integrating differential DNA methylation and gene expression analyses. (X-axis) DNA methylation Q-values (−1 × log10 scale); (y-axis) BH adjusted P-values (−1 × log10 scale). Indicated are genes that are hypermethylated and down-regulated in tumors (red); hypomethylated and up-regulated in tumors (green); hypermethylated and up-regulated in tumors (blue); or hypomethylated and down-regulated in tumors (orange). (C) Top gene networks identified through integrative pathways analysis of significant DNA methylation changes associated with significant inverse gene expression changes. Indicated are genes that are hypomethylated and up-regulated in tumors (green) or hypermethylated and down-regulated in tumors (red). (Solid lines) Direct interaction; (dashed lines) indirect interaction. (D) The most significantly enriched biological process categories within genes showing significant DNA methylation changes associated with significant inverse gene expression changes. (E) Venn diagram of NextBio analysis showing the overlap of our bioset (genes showing significant DNA methylation changes in conjunction with significant inverse gene expression changes) with the three most highly correlated NextBio biosets (see also Supplemental Fig. 6).

