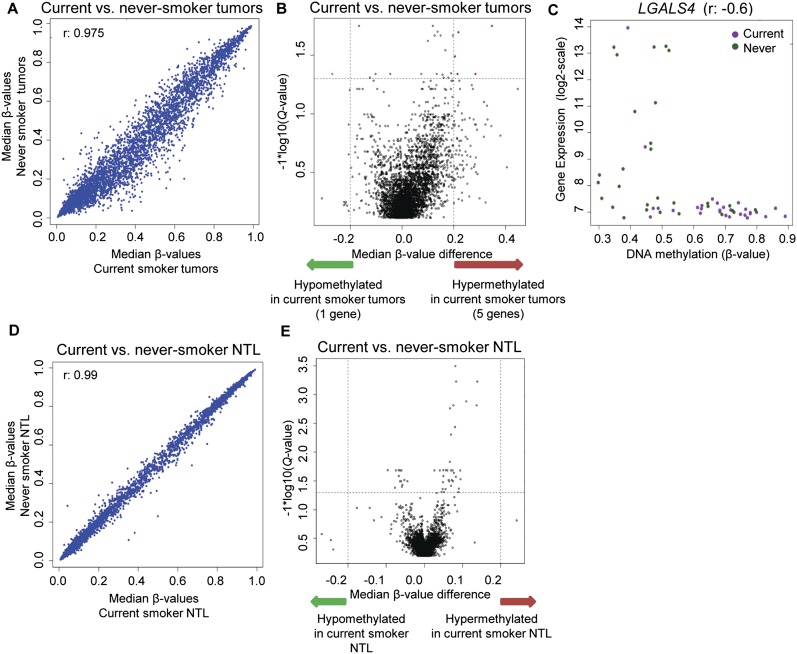
Figure 4.
Identification of DNA methylation differences between lung adenocarcinoma tumors and NTL with regard to smoking. (A) Correlation matrix of median β-values of tumors from current smokers vs. never-smokers, with the Spearman rho correlation given in the top left corner. (B) Volcano plot of the differential DNA methylation analysis between tumors from smokers and never-smokers. (Vertical dotted lines) 20% change in β-values; (horizontal dotted line) the significance cutoff. (C) Correlation plot of DNA methylation vs. expression for LGALS4. The Spearman rho correlation coefficient is provided on top. (D) Correlation matrix of median β-values of NTL from current smokers vs. never-smokers, with the Spearman rho correlation given in the top left corner. (E) Volcano plot of the differential DNA methylation analysis between NTL from smokers and never-smokers. (Vertical dotted lines) 20% change in β-values; (horizontal dotted line) the significance cutoff. No significant DNA methylation differences are seen between NTL from smokers and never-smokers.

