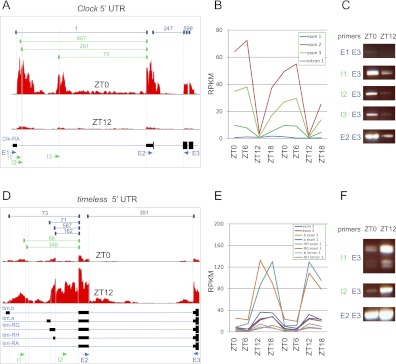
Figure 6.
Novel transcriptional start sites in clock genes. The 5′ UTR and nearby coding exons are shown for Clock (A) and timeless (D). (Solid black bars) Exons; (thin blue lines) introns. (Red histograms) The depth of sequencing coverage at ZT0 and ZT12; (dark blue brackets, top) the number of gapped reads spanning previously annotated splice junctions; (green brackets) the number of gapped reads spanning novel splice junctions. (Arrows, bottom) PCR primers used to assay for the presence of a given splicing event, with blue indicating previously annotated and green indicating novel. (E) Exon primer; (I) intron primer. The expression levels of individual exons and introns are shown for Clock (B) and timeless (E). (C,F) rtPCR was used to detect the presence of splicing events using indicated primer pairs that span a given junction in brains of independent biological replicates collected at ZT0 and ZT12.

