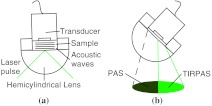
Fig. 3.
(a) Basic physical setup for TIRPAS. (b) Divergent light after passing through the prism/sample interface. The TIR position is represented by the line between the lighter and darker shades at the bottom of the cone. The darker shade represents the part of the excitation beam in photoacoustic spectroscopy and the brighter shade represents the part of the excitation beam under TIRPAS excitation.

