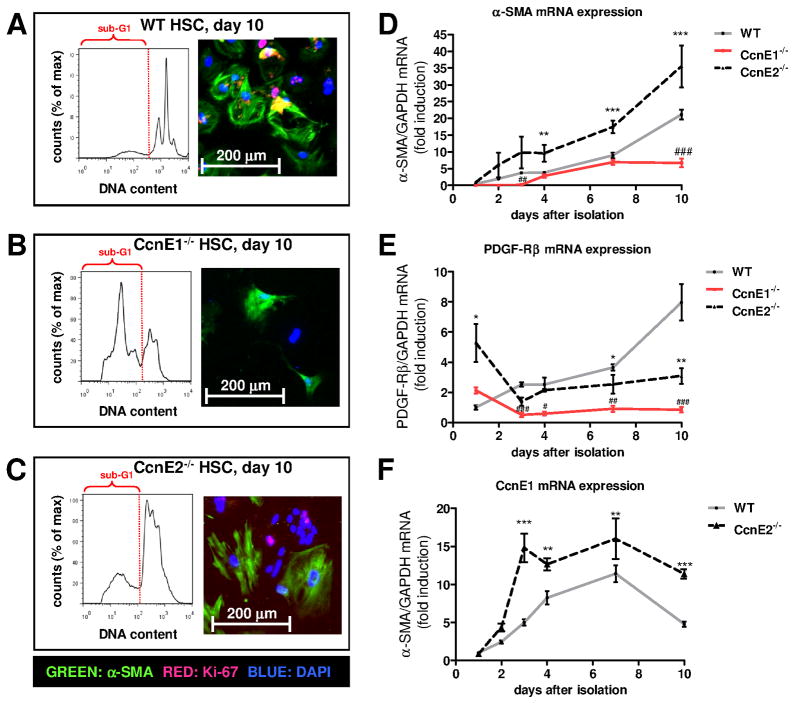
Figure 6. CcnE1 is essential for cell cycle progression and transdifferentiation of HSC.
Primary HSC were isolated from WT, CcnE1−/− and CcnE2−/− mice. A total number of 150.000 cells were seeded per 6-well plate and cultivated for up to 10 days. (A–C) Ten days after cultivation, attached cells were harvested, stained with propidium iodide (PI) and subjected to FACS analysis or analyzed by immunofluorescence staining for Ki-67 (red) and α-SMA (green). Representative FACS histograms demonstrate the DNA content of HSC subpopulations. The sub-G1 population is highlighted and indicates apoptotic cells with DNA content <2n. (A) WT HSC. (B) CcnE1−/− HSC. (C) CcnE2−/− HSC. (D–F) Time-dependent mRNA expression analysis from primary HSC derived from WT, CcnE1−/− and CcnE2−/− mice. (D)α-SMA mRNA expression. **: p<0.01; ***: p<0.001 (WT versus CcnE2−/−); #: p<0.05; ###: p<0.001 (WT versus CcnE1−/−). (E) PDGF receptor beta (PDGF-Rβ) mRNA expression. *: p<0.05; **: p<0.01; (WT versus CcnE2−/−); ##: p<0.01; ###: p<0.001 (WT versus CcnE1−/−). (F) CcnE1 mRNA expression in WT and CcnE2−/− cells; **: p<0.01; ***: p<0.001.

