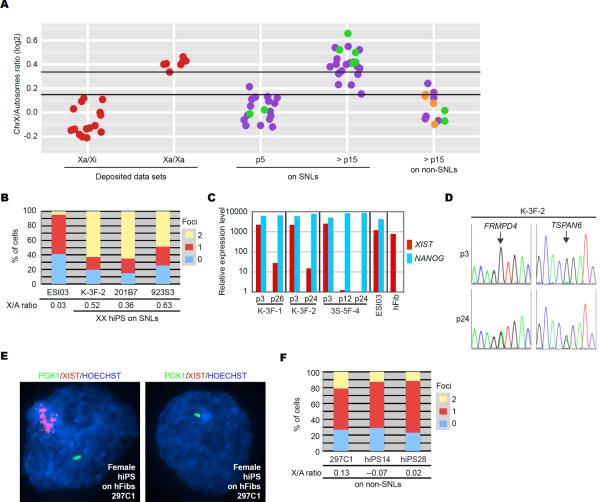
Figure 3. Prolonged Culture Promotes X-Reactivation when Propagated on SNL Feeders.
(A) X/A ratios from hFib-derived female hiPSC lines at p5 or > p15. Cell lines were generated on SNLs or on non-SNLs. X/A ratios from hiPSC lines in which X-inactivation status was further examined in Figure 3 by FISH and/or SNP sequencing are shown in green, including three cell lines used in Figures 1 and 2. Those examined in Figure 4 are shown in orange. X/A ratios from deposited Xa/Xi and Xa/Xa cell lines are shown in red. Cell lines above the upper black line in the graph have a predicted probability of at least 0.95 of being Xa/Xa, while those below the lower black line have a predicted probability of at least 0.95 of being Xa/Xi or a 0.05 probability of being Xa/Xa (see more details in Figure S2 and EXTENDED EXPERIMENTAL PROCEDURES). The X/A ratios are also shown in Table S1.
(B) Graph showing the proportion of cells exhibiting 0, 1 or 2 sites of nascent PGK1 mRNA accumulation in Xa/Xi hESC (ESI03) and three hiPSC lines (K-3F-2, 201B7 and 923S3) on SNLs at > p15. X/A ratios from indicated lines are also shown.
(C) Relative expression levels of XIST and NANOG. RNA from the three hiPSC lines (K-3F-1, K-3F-2 and 3S-5F-4) was extracted at indicated passage number and analyzed by RT-qPCR. NANOG was used as a pluripotency marker. The Xa/Xi hESC line (ESI03) and female fibroblasts (hFib) from which the hiPSCs were generated served as controls. The y-axis is in logarithmic scale. Expression values of XIST in 3S-5F-4 at p24 and of NANOG in hFib were set as 1.0.
(D) SNP sequencing of two X-linked genes (TSPAN6 and FRMPD4) in one hiPSC line K-3F-2 on SNLs at p3 and p24. Arrows show position of SNPs.
(E) RNA FISH for PGK1 (green) and XIST (red) in hiPSCs derived on hFibs. The hiPSC line 297C1 contains a mixed population of cells that do and do not express XIST.
(F) Graph showing the proportion of cells with 0, 1, or 2 sites of PGK1 nascent mRNA accumulation in three hiPSC lines generated and cultured on non-SNLs at > p12. X/A ratios are included beneath the graph.

