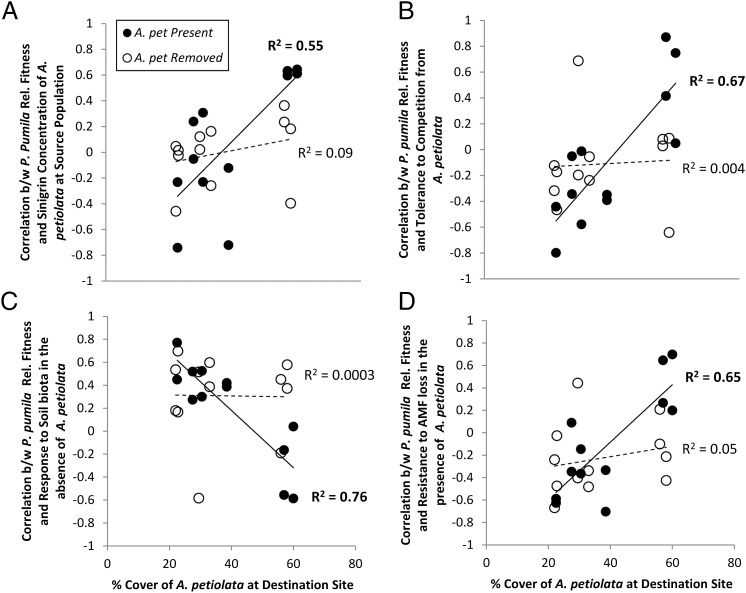
Fig. 3.
Visual representation of the significant three-way interactions in Table 1 between (i) the A. petiolata removal treatment, (ii) the percentage of cover of A. petiolata at destination sites, and (iii) one of four aspects of the P. pumila population. Each point in the graph represents a correlation coefficient, measuring the correlation between the relative fitness of the P. pumila populations and a particular trait or aspect of those populations (analagous to a selection differential). A separate correlation coefficient was calculated for each site, year, and treatment combination: each correlation coefficient was estimated from six underlying data points. For example, in B, each point represents the correlation between the relative fitness of the six native populations in a given site and the tolerance to competition from A. petiolata of each native population as measured in the greenhouse experiment. A positive value implies that populations that were highly tolerant to competition with A. petiolata had the highest relative fitness at that particular site, year, and treatment combination (i.e., would be favored by natural selection). These correlation coefficients were then regressed against the percentage of cover of A. petiolata at a destination site. A shift from negative to positive values across the gradient in percentage of cover of A. petiolata suggests that the selection pressures switch from favoring native populations with low competitive tolerance to those with high tolerance as the intensity of A. petiolata invasion increases. Each panel shows the regression of the correlations between P. pumila relative fitness and a different trait or aspect of those populations against A. petiolata percentage of cover at the destination site. The P. pumila population traits/aspects were the following: (A) the sinigrin concentration of its naturally co-occurring A. petiolata population, (B) the tolerance to competition from A. petiolata, (C) the response to soil biota in the absence of A. petiolata, and (D) the ability of a native population to retain AMF colonization in the presence of A. petiolata. Solid symbols (and solid lines) represent correlation coefficients regressed against A. petiolata cover in the presence of ambient A. petiolata densities, and open symbols (and dotted lines) represent correlation coefficients regressed against (initial) A. petiolata cover in the A. petiolata removal plots. R2 values refer to the variance among correlation coefficients explained by initial A. petiolata cover.

