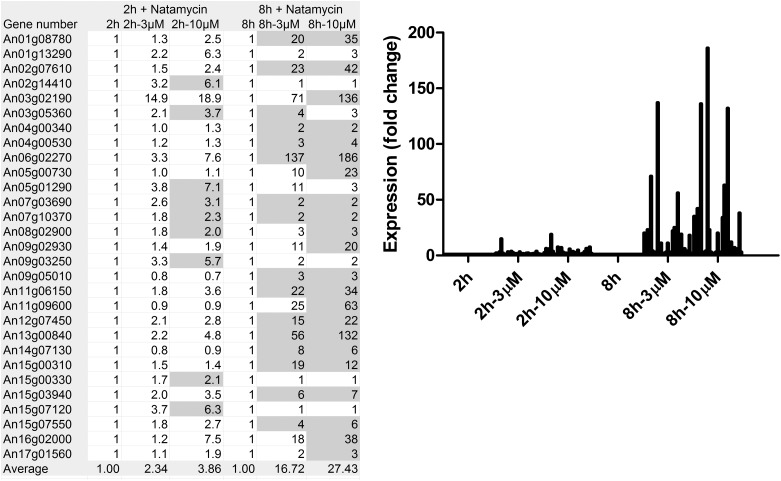
Fig. 1.
Expression of a selection of sugar and amino acid transporters. The expression of 29 sugar and amino acid transporters that were most strongly up-regulated on treatment with natamycin (>120 arbitrary units after 2 or 8 h) is shown. Together, these dominant transporters make up over 90% of the expression intensity of all sugar and amino acid transporters after natamycin treatment. A detailed description of the genes is provided in Table S1. Expression values are given of conidia during different stages of germination (controls) or in the presence of natamycin at different concentrations. The data are given as fluorescence data from three independent microarray experiments. The gray values are significant below the P = 0.01 level.

