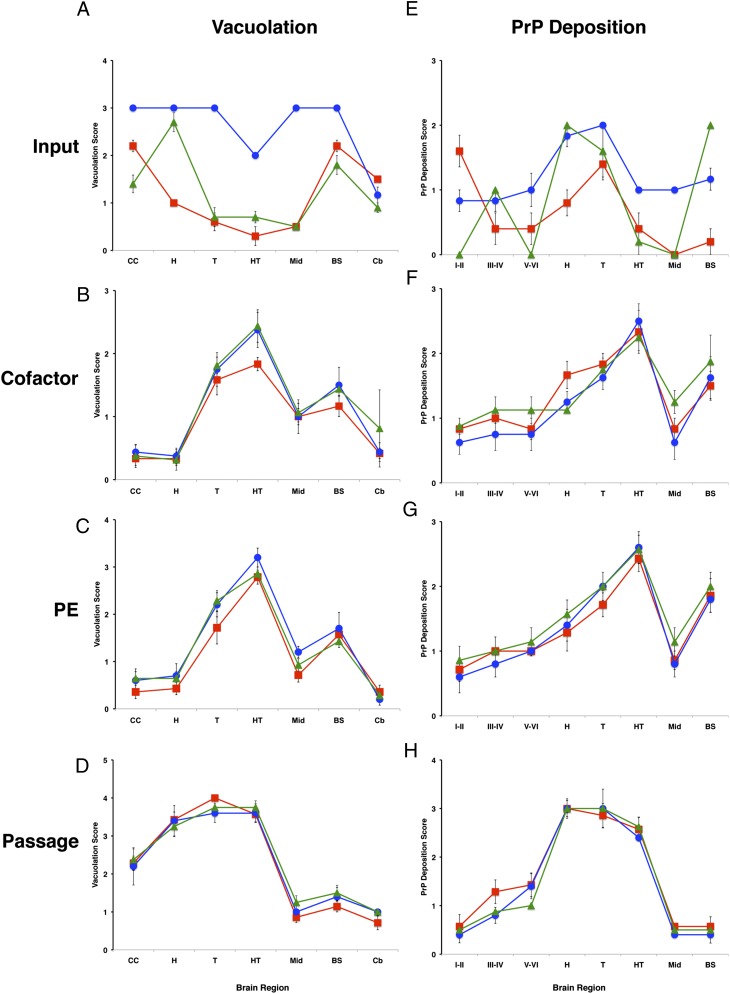
Fig. 4.
Regional neuropathology of infected mice. (A–D) Profiles of vacuolation scores of animals inoculated with samples containing (A) input prions, (B) cofactor PrPSc molecules, (C) PE PrPSc prions, or (D) serial-passage PE PrPSc prions. (E–H) Profiles of PrP deposition scores of animals inoculated with samples containing (E) input prions, (F) cofactor PrPSc molecules, (G) PE PrPSc prions, or (H) serial-passage PE PrPSc prions. Prion strains: OSU, red squares; Me7, blue circles; 301C, green triangles. Brain regions: I–II, cerebral cortical layers 1 and 2; III–IV, cortical layers 3 and 4; V–VI, cortical layers 5 and 6; BS, brainstem; Cb, cerebellum; CC, cerebral cortex (all layers); H, hippocampus; HT, hypothalamus; Mid, midbrain; T, thalamus. Mean values ± SEM are shown; n = 5.

