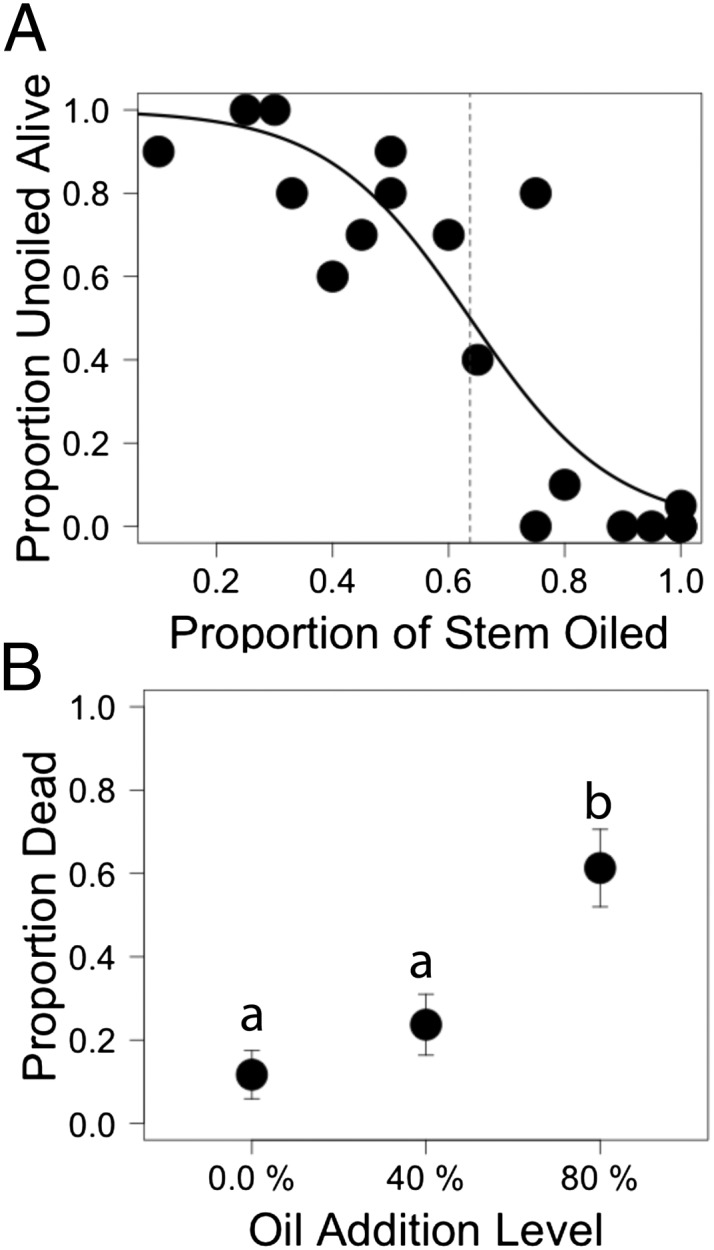
Fig. 3.

Oil cover versus plant death as assessed from field observations and from manipulations. (A) Field observations of level of oil on individual plants and resultant plant death, indicated by blade browning. The proportion of plant stems that were green and alive is greater than the proportion dead (i.e., indicating improved health) when oil coverage dropped below 64%. (B) Observation of blade browning 30 d after a treatment of oil coverage of 40% or 80% of the plant’s height (n = 6 per oil-addition treatment). Superscript letters indicate treatments that were significantly different (P < 0.05) based on Tukey's HSD post hoc comparison. Error bars are SEs.
