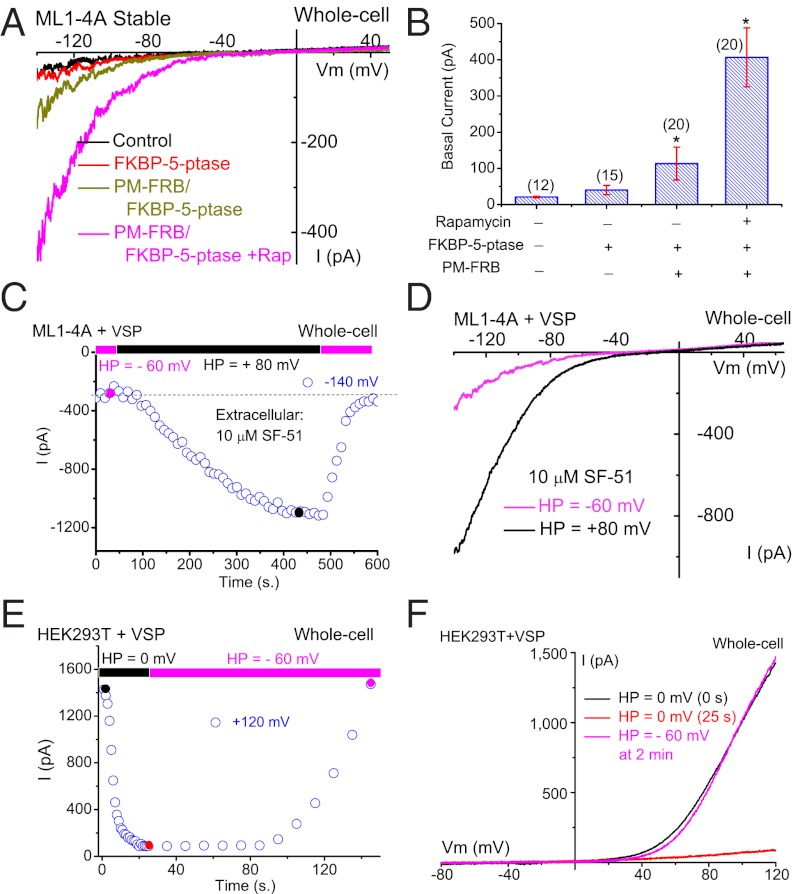
Fig. 3.
Depletion of PI(4,5)P2 levels increases whole-cell TRPML1 currents. (A) Overexpression of cytosolic FKBP-5′-phosphatase along with rapamycin-induced translocation to the PM enhanced basal whole-cell IML1-4A. IML1-4A was measured in the whole-cell configuration with repeated voltage ramps (from –140 to +140 mV; 400 ms; 4-s interval between ramps; HP = 0 mV). Only a portion of the voltage is shown. The pipette solution contained Cs+-based internal solution (145 mM Cs-Mes), and the bath was standard external (Tyrode’s) solution. HEK293 cells stably expressing ML1–4A were transfected with RFP-FKBP-5-phosphatase alone or together with CFP-PM-FRB, which contains a signal for the PM localization. The dimerization of FRB and FKBP induced by rapamycin (0.5 μM for 10 min) led to translocation of the 5-phosphatase from the cytosol to the PM. (B) Summary effects of overexpression and PM translocation of 5-phosphatase on basal IML1-4A. Rapamycin significantly enhanced basal IML1-4A. (C) Depolarization-activated Ci-VSP 5-phosphatase increased SF-51–activated IML1-4A in Ci-VSP–transfected ML1–4A stable cells. IML1-4A was elicited by repeated voltage ramps (from –140 mV to +100 mV; 100-ms duration; 10-s interval between ramps; HP = –60 mV or +80 mV). Current amplitudes measured at −140 mV were used to plot the time-dependence of the depolarization-induced effect. (D) Representative traces of SF-51-activated IML1-4A before (HP = −60 mV, red) and 8 min after (HP = +80 mV, black) Ci-VSP activation at two time points, as shown in C. (E) Activation of Ci-VSP (HP = 0 mV) led to rapid suppression of endogenous TRPM7-like currents in Ci-VSP–transfected HEK293T cells. TRPM7-like currents were induced by omission of Mg2+ in both bath and internal/pipette solutions (HP = -60 mV for >3 min after break-in), and then elicited by repeated voltage ramps (from –100 mV to +120 mV; 100-ms duration; 1- or 10-s interval between ramps; HP = 0 mV or –60 mV). (F) Representative I-V traces of TRPM7-like currents before (HP = 0 mV, 0 s) after Ci-VSP activation (HP = 0 mV, 25 s), and after Ci-VSP deactivation (HP = –60 mV, 25 s) at three time points, as shown in E. Data are presented as mean ± SEM; numbers (n) are noted in parentheses. Statistical comparisons were performed using analysis of variance. *P < 0.05.

