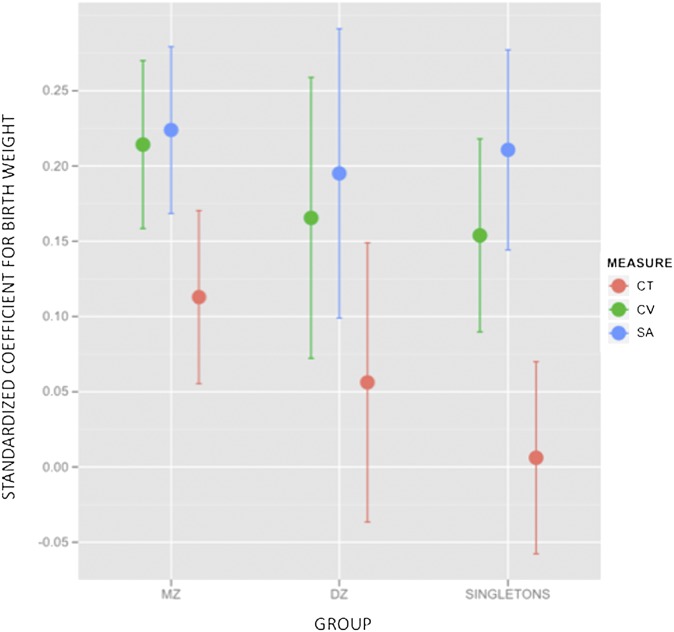
Fig. 2.
Whisker plot showing standardized coefficients (and 95% coefficient confidence intervals) for the age-invariant main effect of BW variation on CV, CT, and cortical SA within each of the three groups examined in this study. Note that changes in CV and SA for changes in BW are both similar to each other within each group as well as across groups.

