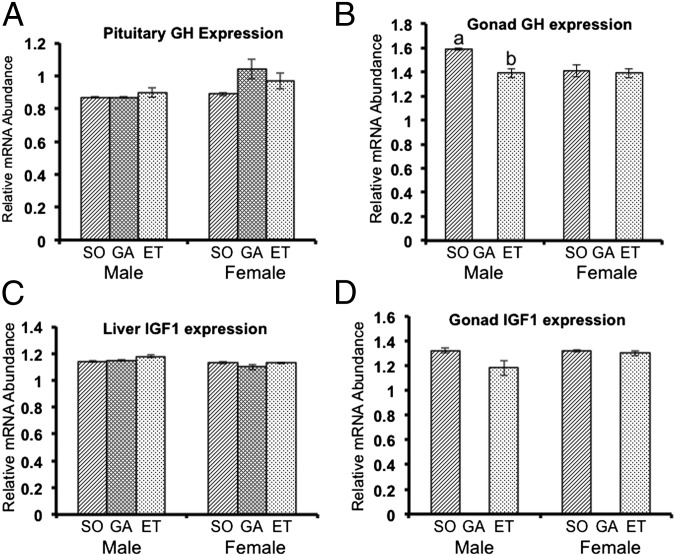
Fig. 5.
Quantitative real-time PCR analysis of expression of GH and IGF-I mRNAs in various tissues, using the EF1α gene as an internal control. (A) GH expression in the pituitary. (B) GH expression in the gonads. (C) IGF-I expression in the liver. (D) IGF-I expression in the gonads. No significant differences were seen among treatments. Results are given as mean ± SEM. Values with different letters are significantly different (P < 0.05; n ≥6). ET, ectopically transplanted; GA, gonadectomized; SO, sham-operated.

