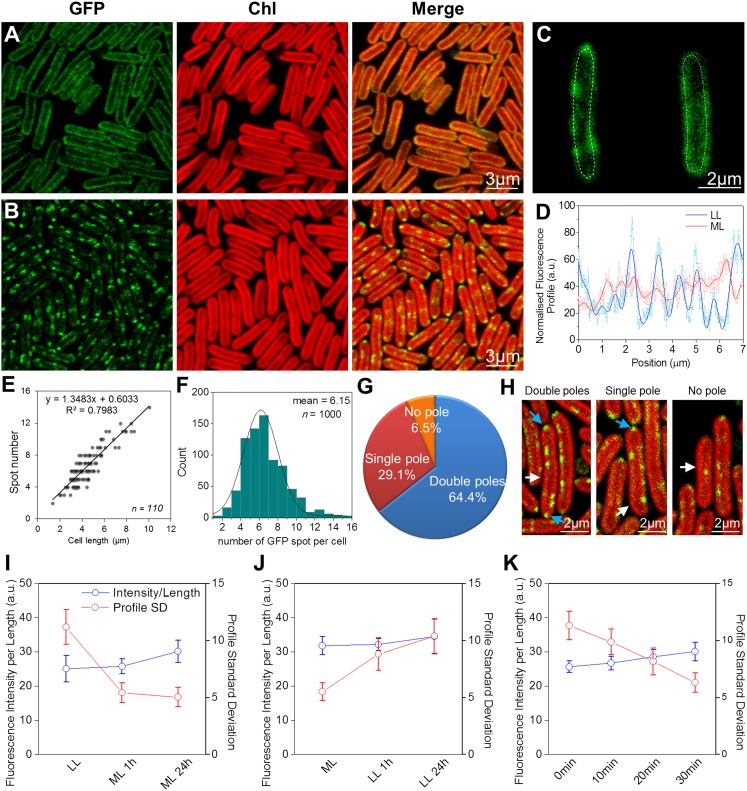
Fig. 1.
Localization of NDH-1:eGFP complexes in Synechococcus. (A) NDH-1:eGFP distribution in cells adapted to ML. (B) NDH-1:eGFP distribution in cells under LL. (C) Examples of GFP fluorescence profiles along the thylakoid membranes. (D) Raw and smoothed normalized fluorescence profiles of the tracing lines in C. (E) NDH-1 spot number per cell is proportional to the cell length (n = 110). (F) NDH-1:eGFP spot numbers per cell (n = 1,000). (G) Frequency of occurrence of NDH-1:eGFP spots at the cell poles (n = 800). (H) Examples of polar localization. White and cyan arrows indicate the cell NDH-1:eGFP spots, respectively. (I) Fluorescence profile SDs (red) and normalized fluorescence intensities (blue) of NDH-1:eGFP cells under LL, and 1 h, 24 h after transferring to ML (n = 50, P = 10−7). (J) Fluorescence profile SDs (red) and normalized fluorescence intensities (blue) of NDH-1:eGFP cells adapted to ML, and 1 h, 24 h after transferring to LL (n = 50, P = 10−7). (K) Fluorescence profile SDs and normalized fluorescence intensities for a set of low-light–grown NDH-1:eGFP cells exposed to intense light (500 μE⋅m−2⋅s−1) for 10, 20, and 30 min (n = 50). The corresponding confocal images are shown in Fig. S6.

