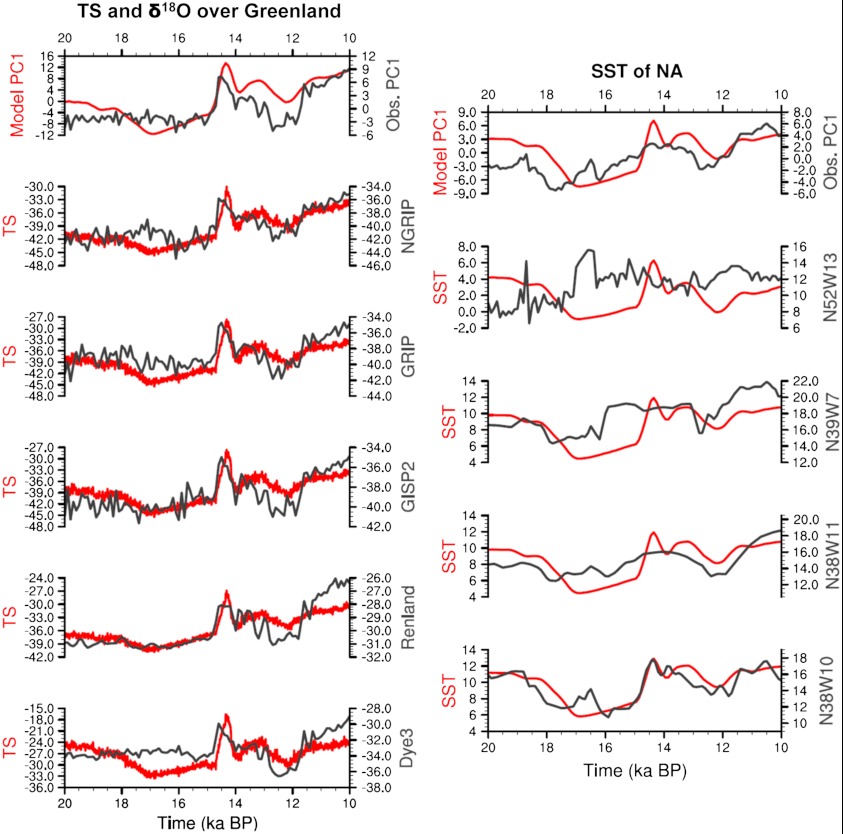
Fig. 2.
(A) Greenland ice core δ18O records (black) and the corresponding decadal mean model annual temperatures (red). (B) Four SSTs in the northern North Atlantic from the proxy (black) and model (red). The time coefficients of the Empirical Orthogonal Function mode 1 (EOF1) for the proxy (black) and model (red) are also plotted on the top in each panel. It is seen that the GISP2 record is typical of the Greenland ice cores, and its evolution is almost identical to that of the EOF1 coefficient. The northern North Atlantic SSTs and their EOF are also largely consistent in the proxy and the model, both exhibiting a warmer YD than OD. N52W12(8), N39W7(9), N38W11(7), N38W10(10).

