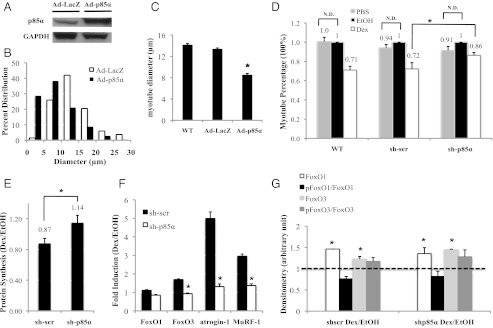
Fig. 5.
Effect of p85α overexpression and knock-down on C2C12 myotube cell diameters. (A) Immunoblot was performed in Ad-LacZ and Ad-p85α myotubes to detect p85α protein levels. (B) The distribution of cell diameters in Ad-LacZ and Ad-p85α myotubes. (C) The average cell diameter of WT, Ad-LacZ, and Ad-p85α myotubes. (D) WT, sh-scr, and sh-p85α myotubes were treated with Dex, EtOH, or PBS for 72 h; EtOH-treated WT, sh-scr, and sh-p85α myotube diameters were set as 1 (100%) for Dex-treated or PBS-treated WT, sh-scr, and sh-p85α myotubes, respectively. N.D. specifies “no difference.” (E) Protein synthesis level was measured for sh-scr and sh-p85α myotubes, with the EtOH-treated sh-scr and sh-p85α myotube protein synthesis level set as 1 for Dex-treated sh-scr and sh-p85α myotubes, respectively. (F) FoxO1, FoxO3, atrogin-1, and MuRF-1 gene expressions in sh-scr and sh-p85α myotubes. Rpl19 primer was the internal control. (G) Protein levels of phosphorylated and total FoxO1 and FoxO3 are shown for sh-scr and sh-p85α myotubes. (C–G) *P < 0.05. The error bars represent the SE for diameters. These results are averaged from at least three independent experiments.

