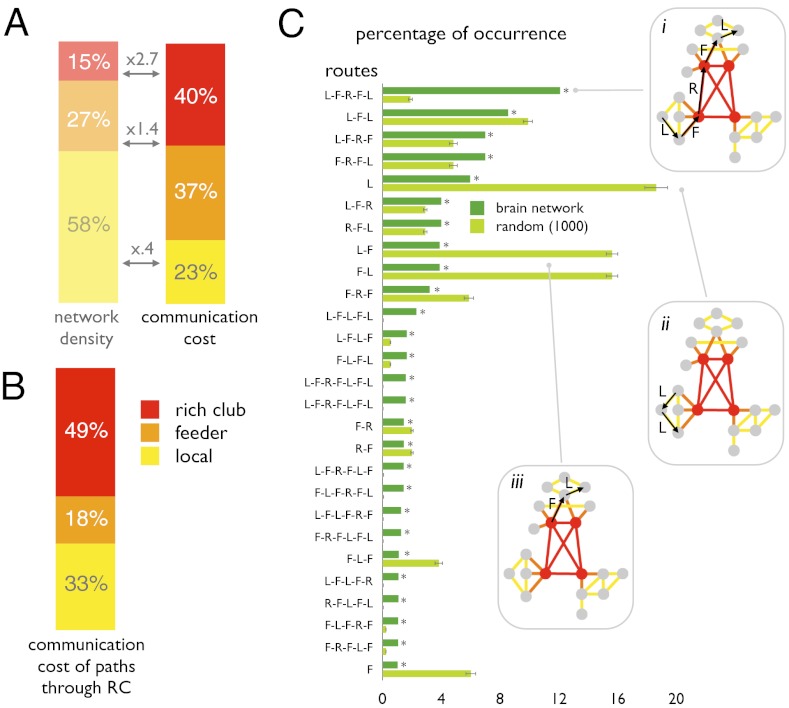
Fig. 3.
(A) Contributions to communication cost of local feeder and rich club connections. (B) Communication cost of paths that pass through the rich club (69% of all paths). (C) Frequencies of a selection of path motifs in the brain network (main text), all occurring with a frequency greater than 1%, and their corresponding frequencies in a set of a 1,000 random networks, preserving degree sequence. L-F-R-F-L was the most common path motif in the brain network (*P < 0.05, Bonferroni corrected; SI Materials and Methods).

