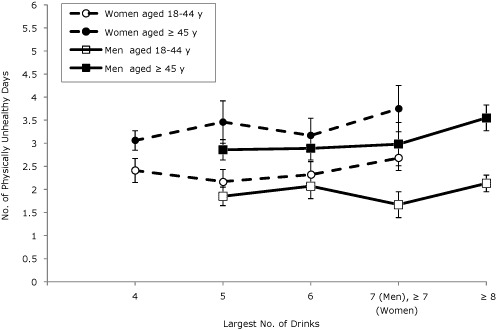
Figure 1.
Predicted mean number of physically unhealthy days by sex and age among binge drinkers, adjusted for race/ethnicity, education, marital status, income, employment, and survey year. Binge drinking is defined as 4 or more drinks for women and 5 drinks or more drinks for men on an occasion. Error bars indicate 95% confidence intervals. Data are from 50 states and Washington, DC; Behavioral Risk Factor Surveillance System, 2008-2010.
| Characteristic | Predicted Mean Physically Unhealthy Days | ||||
|---|---|---|---|---|---|
|
| |||||
| 4 drinks | 5 drinks | 6 drinks | 7 drinks (men), ≥7 drinks (women) | ≥8 drinks | |
| Women aged 18-44 y | 2.41 (2.15-2.67) | 2.17 (1.91-2.44) | 2.32 (2.04-2.60) | 2.68 (2.41-2.94) | NA |
| Women aged ≥45 y | 3.06 (2.85-3.27) | 3.46 (3.00-3.92) | 3.17 (2.80-3.55) | 3.75 (3.25-4.25) | NA |
| Men aged 18-44 y | NA | 1.85 (1.65-2.06) | 2.07 (1.80-2.35) | 1.67 (1.39-1.96) | 2.13 (1.95-2.30) |
| Men aged ≥45 y | NA | 2.86 (2.64-3.07) | 2.89 (2.64-3.14) | 2.98 (2.51-3.45) | 3.55 (3.27-3.84) |

