Figure 2.
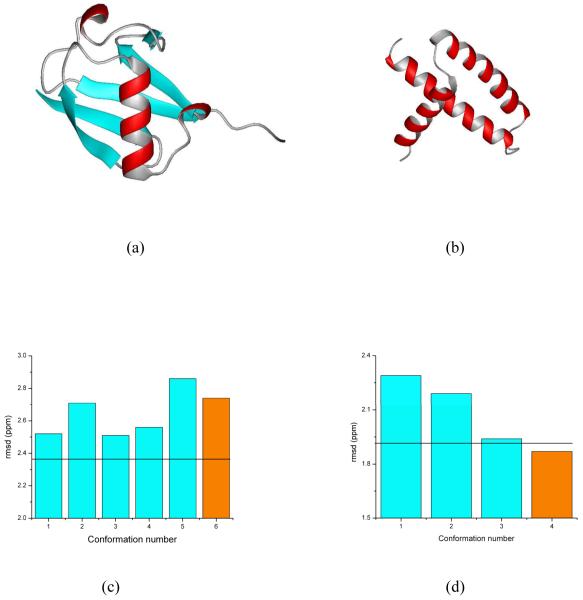
Panels (a) and (b) show the ribbon diagram of the protein models of ubiquitin and the RNA-binding domain of the nonstructural protein 1 of the influenza A virus, respectively; these models were obtained46 after one round of Simulated Annealing Refinement (SAR) starting from the deposited PDB structures of 1UBQ and 1AIL, and represented by the orange bars in (c) and (d); these two panels also show the bar diagram of the rmsd between computed and observed 13Cα chemical shifts, as cyan-filled bars, for the generated ensemble of conformations, generated from the SAR PDB models and, at the same time, showing R and Rfree factors similar to those of the deposited X-ray structure;46 the black solid horizontal lines represent the ca-rmsd for each ensemble (2.36 ppm and 1.92 ppm for UBQ and AIL, respectively).

