
Fig. 4.
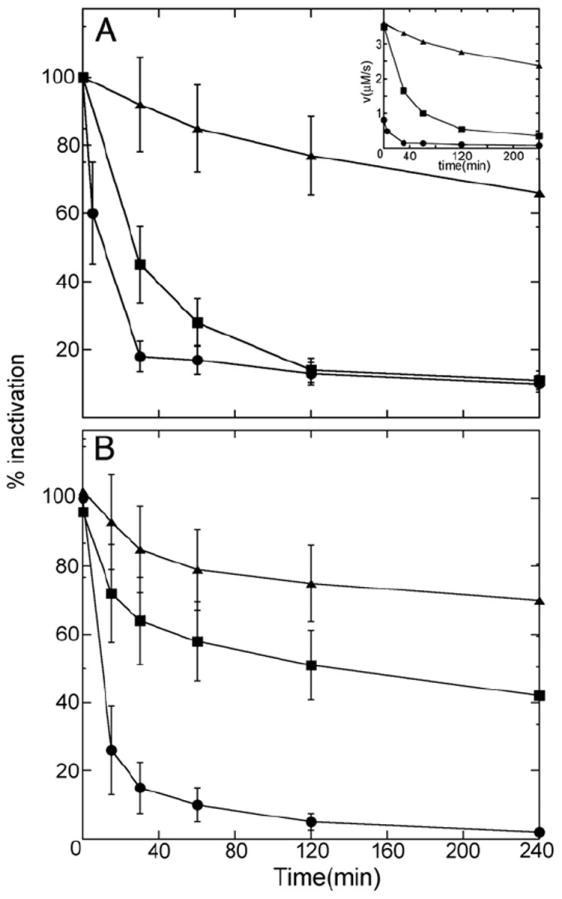
Truncated SmTGR and wild type yeast GR inhibition with AF and the effect of BzSe. Panel A: time course of truncated SmTGR 3 μM in the presence of 8 μM AF(-▲-) or 8 μM AF plus 3 μM BzSe (-■-); wtSmTGR 20 nM exposed to 50 nM AF (-●-). The error bars are drawn to represent ± 1 SD. In the inset the time course of a representative experiments plotted against initial velocities is shown in order to compare the relative velocities between C-terminal truncated and wild type TGR. Panel B: time course of the wild type yeast GR 0.5 μM in the presence of 1 μM AF (-▲-), 4 μM AF (-■-) and 4 μM AF plus 2 μM BzSe (-●-). The error bars are drawn to represent ± 1 SD.