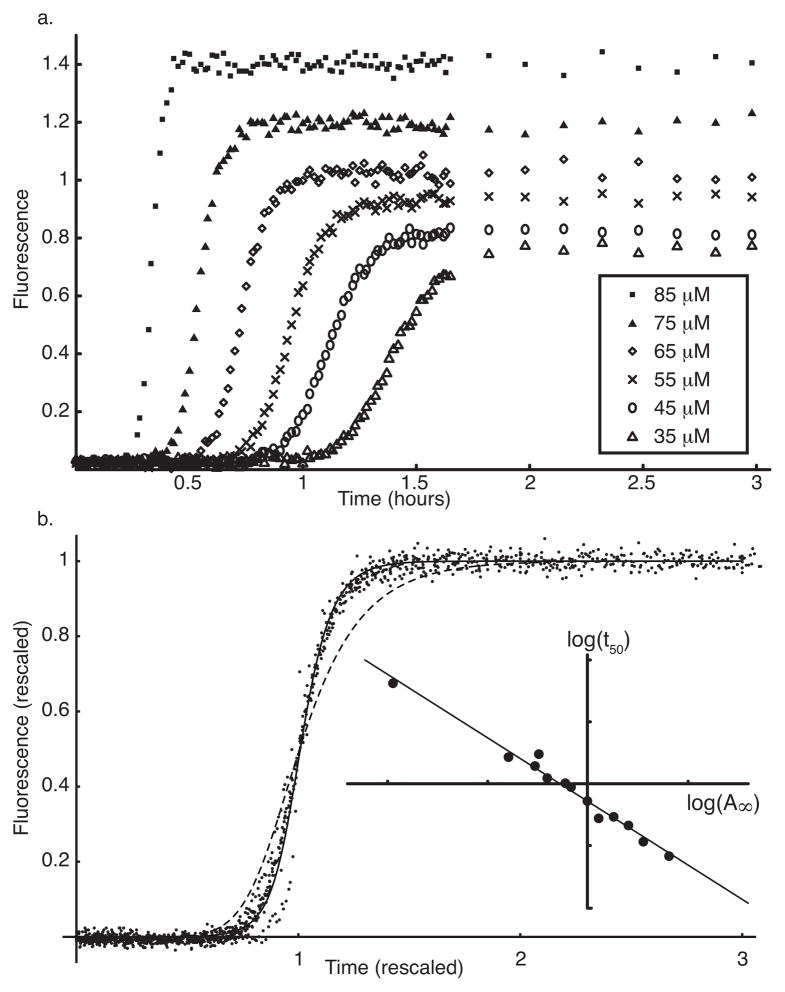
Figure 2.
hIAPP fibrillization data and analysis. a. Thioflavin-T fluorescence was measured for 14 initial hIAPP monomer concentrations over 3h. Six sample curves are shown. b. Rescaling each data curve by its maximum fluorescence (A∞) and time to 50% of maximum (t50) collapses the data. All 14 data sets are shown as dots. Dashed line indicates the best fit to the rescaled data using the basic nucleation dependent polymerization (NDP) model; solid line indicates the best fit using the NDP model with an off-pathway branch. Inset: Log-log plot of t50 vs. A∞ for all data sets with the best fit line y = −2.06x − 0.14.

