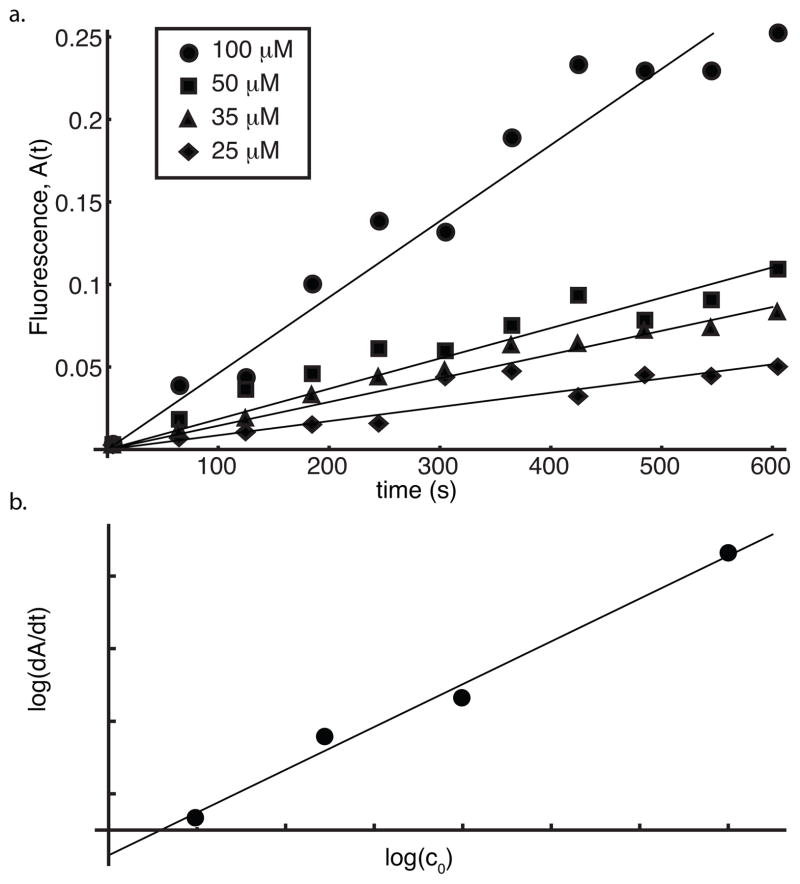
Figure 3.
hIAPP elongation kinetics using pre-formed nuclei. a. Fluorescence time course data is plotted for four experiments with different concentrations of hIAPP monomers (25, 35, 50 and 100 μM) and best fit lines are shown for each experiment. b. The slopes of the best fit lines are plotted against the monomer concentration on a log-log plot.

