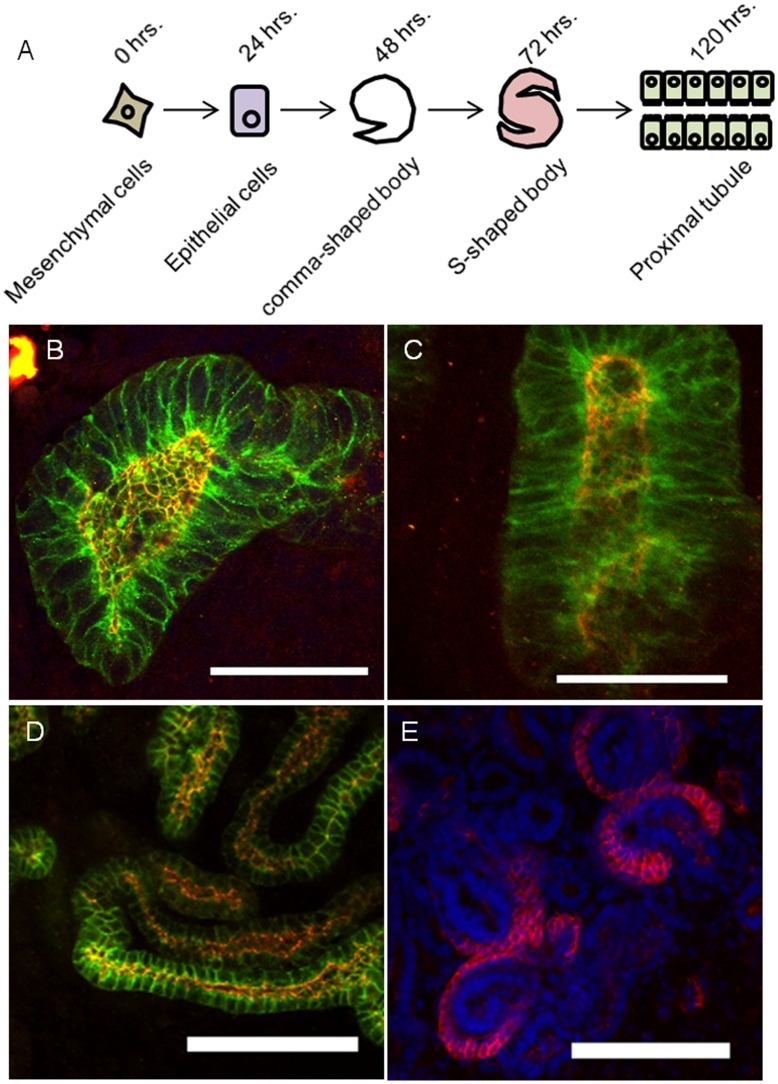
Figure 1. Development of epithelial characteristics and nephron segmentation.
(A) A diagram showing the morphological progression of nephron development ex vivo, and the corresponding culture time. B) Immunofluorescent image of a 2 day (early) nephron culture. The tight junction marker ZO-1 is shown in red, and the adherens junction and marker E-cadherin is shown in green (panels B-D). C) Immunofluorescent image of 3 day (early) nephron culture. D) Immunofluorescent image of the convoluted late tubule (5 days and beyond). E) Immunofluorescent image of a 5 day (late) nephron culture. Peanut lectin marks developing podocytes (red), DAPI (blue). The late nephron begins segment specific differentiation. Bar is 50 µm (B, C, E) or 100 µm (D).

