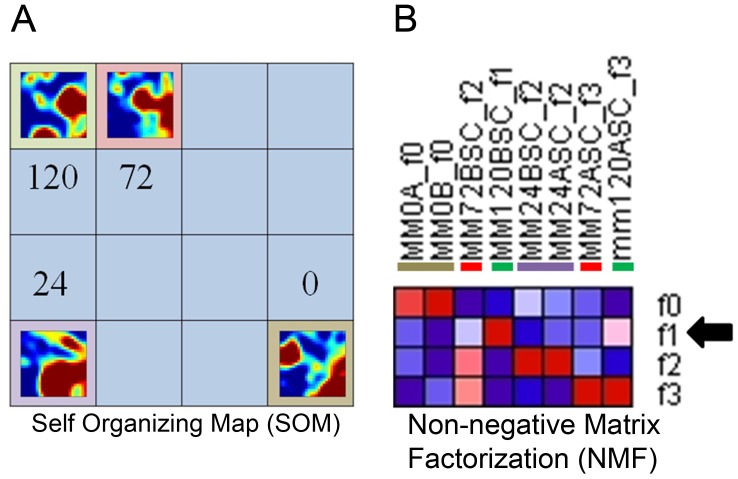
Figure 3. Informatic analysis of cultured nephrons highlights global stages of nephron development.
A) self organizing map (SOM) featuring meta-meta representations of four points in nephron culture. Increasing distance between the samples on the map corresponds to increasing difference in the abstracted transcriptome. B) Non-negative matrix factorization (NMF) of the samples represented in panel A. The arrow highlights metagene F1, which comprises genes highly expressed only after 5 days (120 hours) in culture.

