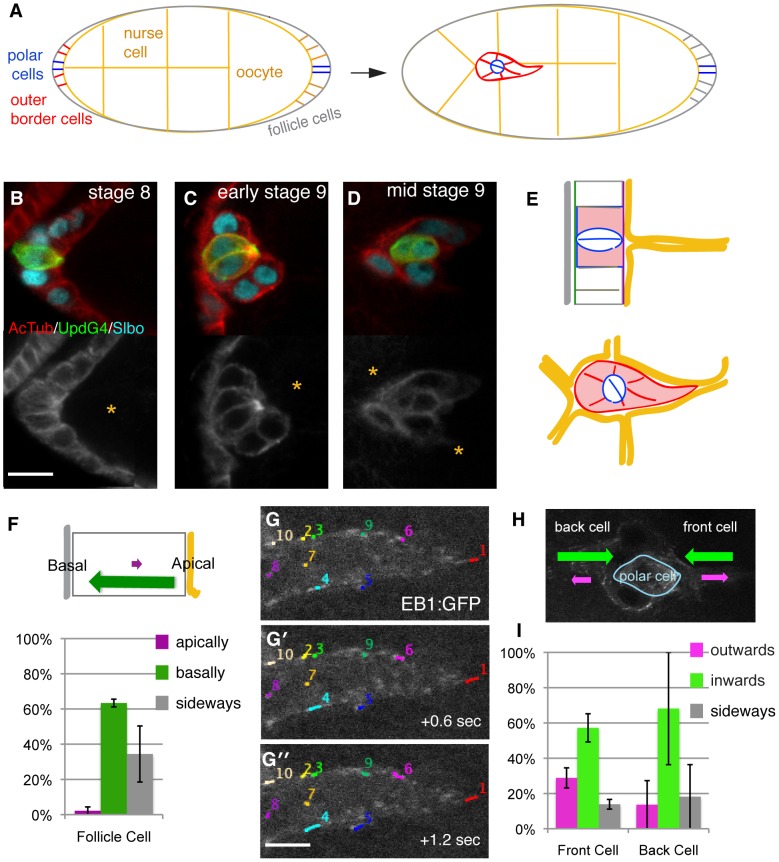
Figure 1. Microtubule organization and polarity in border cell clusters.
(A) Schematic of egg chambers before (left) and after (right) initiation of border cells migration. In this and all other figures, anterior is to the left and cells migrate to the right. Border cells (red) and polar cells (blue) are indicated. (B-D) Close-up of border cell clusters at indicated stages (before, at and after initiation of migration) from genotype: Upd-Gal4; UAS-PH-GFP (green, identifies polar cells) stained with anti-slbo (cyan) and anti-actylated tubulin (red above and white below). (Scale bar: 10 µm). Yellow asterisk indicates nurse cells. (E) Schematics illustrating cell organization before (upper panel) and during (lower) border cell migration. Apical surface (purple line) is toward yellow germ line cells. (F) Direction of tracked EB1-GFP dots in follicle cells showing microtubule growth bias. Schematic above, quantification below; 22 tracks from 2 movies. (G) Three cut-out frames from movie S1 illustrating tracking of EB1-GFP dots in the front part of the front border cell (Scale bar: 4 µm). (H) Summary of direction of EB1-GFP dots in migrating border cells showing microtubule growth bias. (I) Quantification of EB1-GFP dots in border cell clusters; schematic above, quantification below. 131 tracks from 7 movies were analyzed, SEM indicated; P<0.05 for outwards versus inwards movement.

