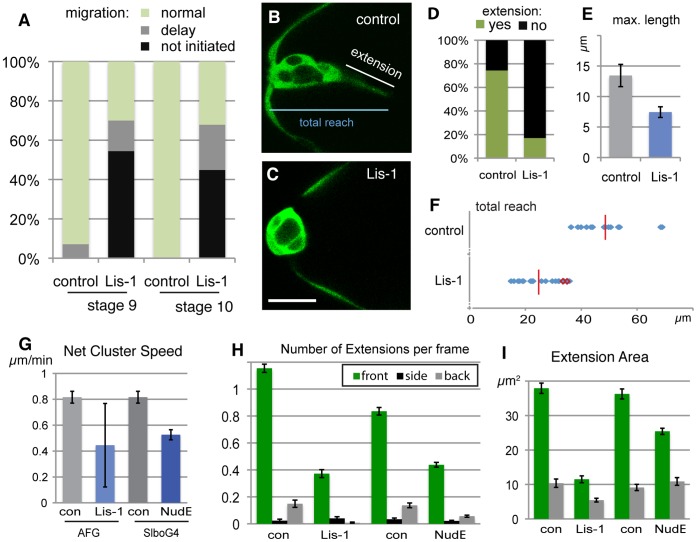
Figure 5. Lis-1 affects initiation of migration, and actual migration, of border cells.
(A) Quantification of border cell migration status for stage 9 and stage 10 egg chambers. Genotypes hsFLP/+; AFG,10×GFP/+and hsFLP/+(control); hsFLP/+;lis-1KK108813/+;AFG,10×GFP/lis-1GD1480 (Lis-1). (B, C) Stills from movies of border cells (marked by GFP) at initiation stage (early stage 9) genotypes as in A. Scale bar: 20 µm. (D) Presence of forward extension, per frame, from movies as in B,C. (E) Maximum length of extensions manually identified from movies of early stage 9 clusters (n = 15, 25) as in B, C. (F) Total forward reach (see B) for control clusters at time of detachment from anterior end (n = 15); for Lis-1 RNAi clusters maximal forward reach in movie, only 3 (red) detach (n = 21) (G) Quantification of net speed from movies of migrating border cell clusters. Genotypes as in A as well as slboGal4,10×GFP/+ (control) and slboGal4,10×GFP/nudEGD15226 (NudE); n = 3 for Lis-1 (escapers) n = 13 for NudE and difference to control is significant (P<0.01). (H) Presence of cellular extensions from the migrating cluster (per movie frame), genotypes as in G. Differences to control are significant for both NudE and Lis-1 (P<0.0001). (I) Average area of front and back extensions from migrating clusters. genotypes as in F. Front extensions were significantly different from control for both Lis-1 and NudE (P<0.0001).

