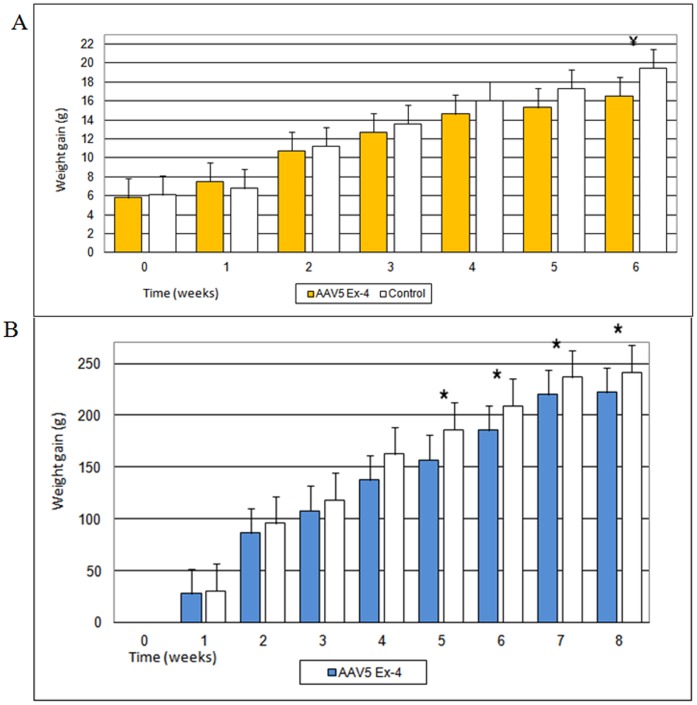
Figure 2. Weight gain of High Fat Diet mice (n = 20) and Zucker fa/fa rats (n = 10) following vector administration.
The graphs represent the average values (g) ± Standard Error (SE). Weight gain is expressed as difference (g) between weight at study point and baseline value. (A) Weight gain of High Fat-Diet mice. Each group was composed of ten mice. ¥ = p<0.01. (B) Weight gain in Zucker fa/fa rats. Each group was composed of five rats. * = p<0.05.

