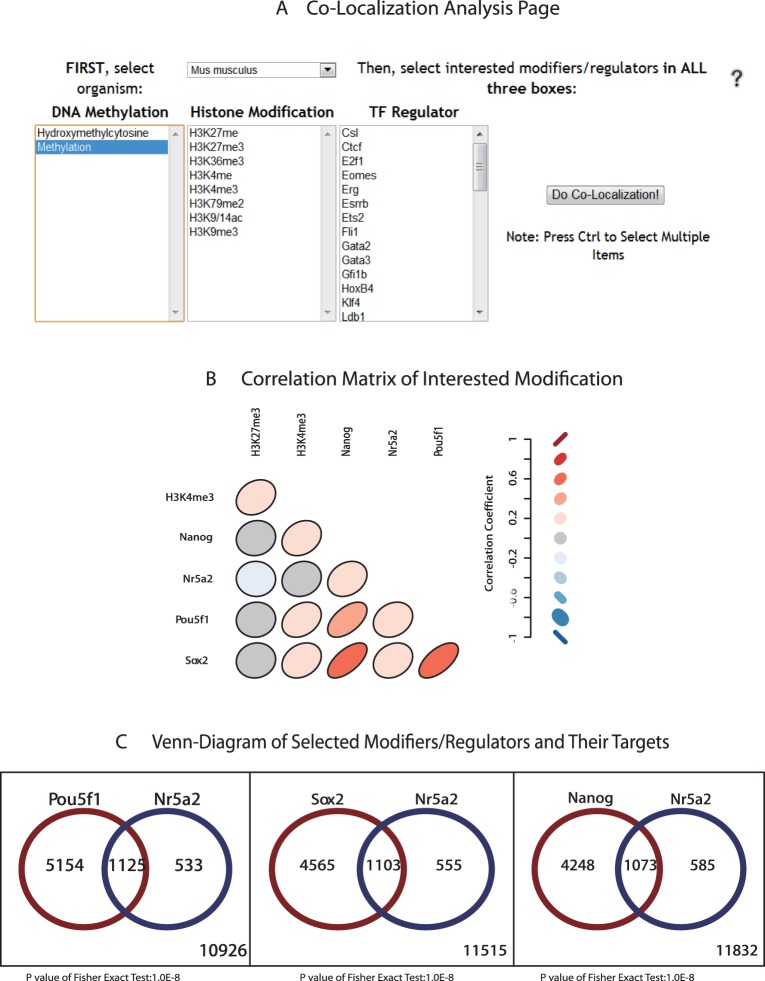
Figure 5. Co-Localization analysis page and example.
(A) Analysis can be carried in two organisms (human and mouse) and three regulation levels (CpG hydroxy/methylation, histone modification and transcription factor binding) (B) Correlation matrix created by selecting interested modifiers/regulators (Pou5f1, Nr5a2, Sox2, Nanog, H3K4me3 and H3K27me3) in mouse. The color of red and shape close to slash indicate more positive correlation, while the color of blue and shape close to backslash indicate negative correlation, and the color of grey and shape like circle indicate no correlation. (C) Venn-diagram of Pou5f1 targeted genes and Nr5a2 targeted genes. Gene list in each part of the plot can be downloaded separately to run enrichment analysis in DAVID.

