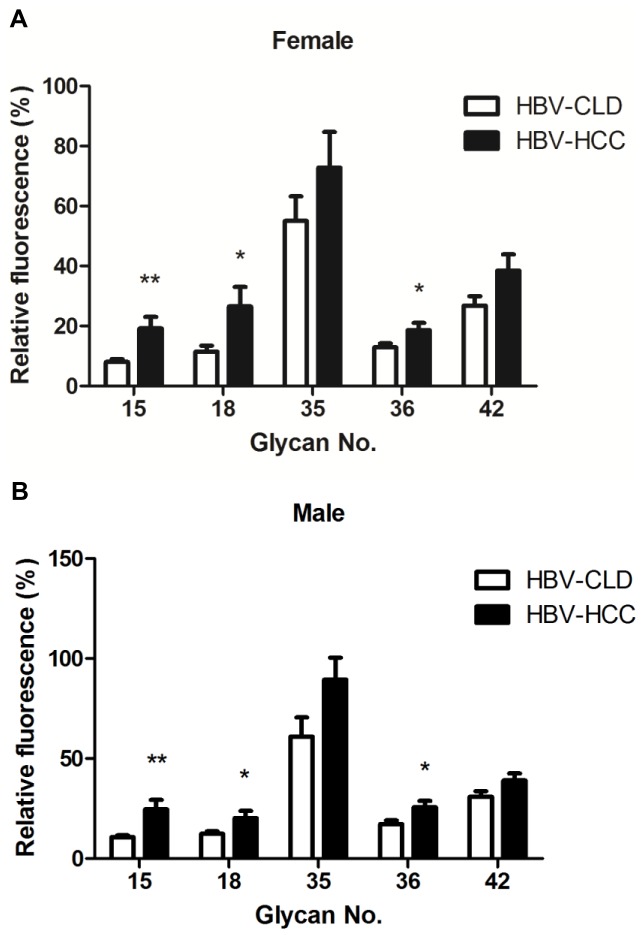
Figure 4. Comparison of the level of select anti-glycan antibodies from HBV-related HCC and CLD by gender.
Relative fluorescence ratios were calculated as the fluorescence intensity for each glycan analog divided by the fluorescence intensity for Gb5, and they are expressed as percentages in the figures. The figure shows the mean ratio ± standard deviation for each glycan. The ratios for glycan numbers 15, 18, and 36 were significantly higher from HBV-related HCC than CLD (HBV) in females (n = 30 and 44, separately) (A) and males (n = 102 and 89, separately) (B). The p values were calculated with a Student’s t-test (*P<0.05, **P<0.01, ***P<0.001).

