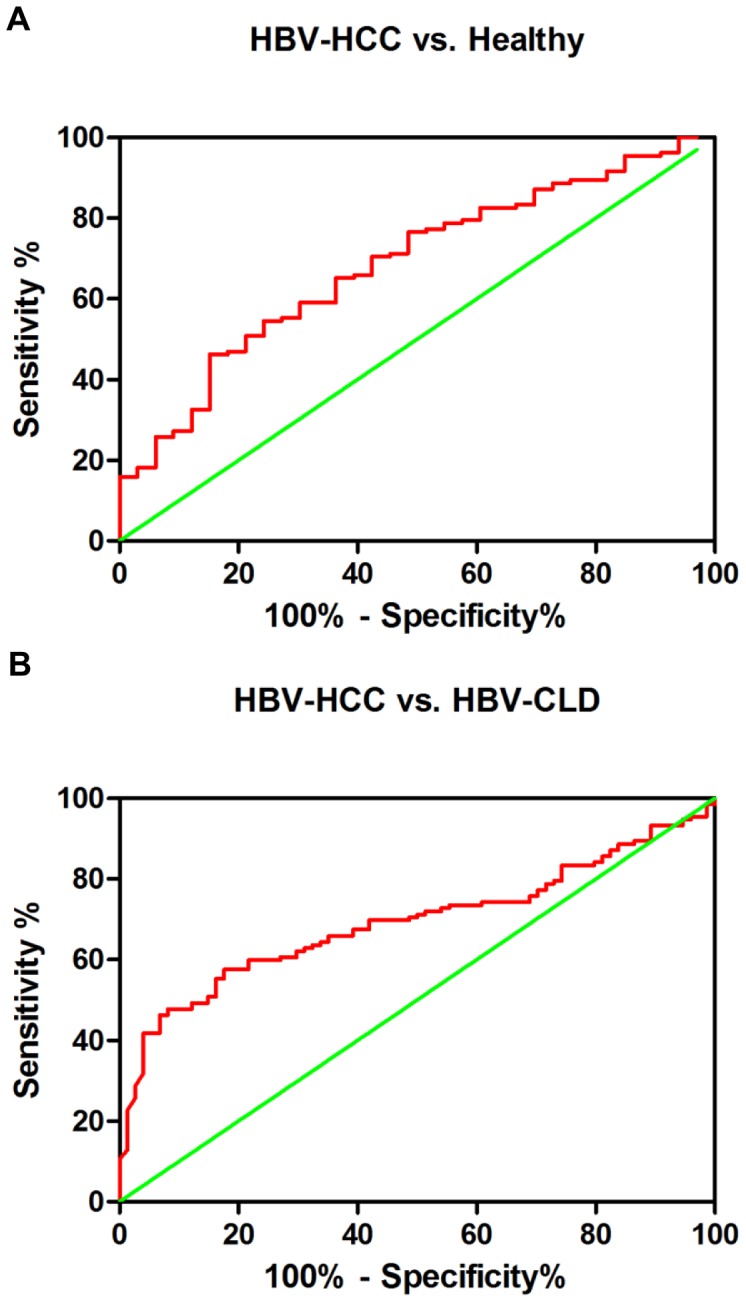
Figure 6. ROC curve analysis using serum anti-glycan antibodies for discriminating HCC patients from HBV-CLD patients and healthy controls.

These 3 anti-glycan antibodies yielded an AUC (the areas under the ROC curve) of 0.6843 (95% CI: 0.5882–0.7805) with 46.21% sensitivity and 84.85% specificity for discriminating HCC patients from healthy controls (A), and an AUC of 0.6923 (95% CI: 0.6215–0.7631) with 57.58% sensitivity and 82.43% specificity for discriminating HCC from HBV-CLD patients (B).
