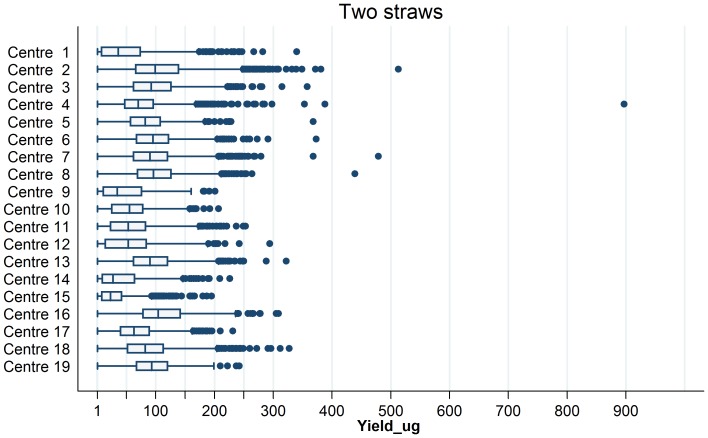
Figure 1. Distribution of yield (µg) for DNA samples extracted with 2 aliquots of buffy coat.
Representation of DNA yield for DNA extractions performed from 2 buffy coat aliquots. Boxes extend from 25th to 75th percentiles and are divided by a solid line representing the median of each center. Whiskers extend from lower to upper adjacent values as defined by Tukey. Outliers are denoted by a dot.

