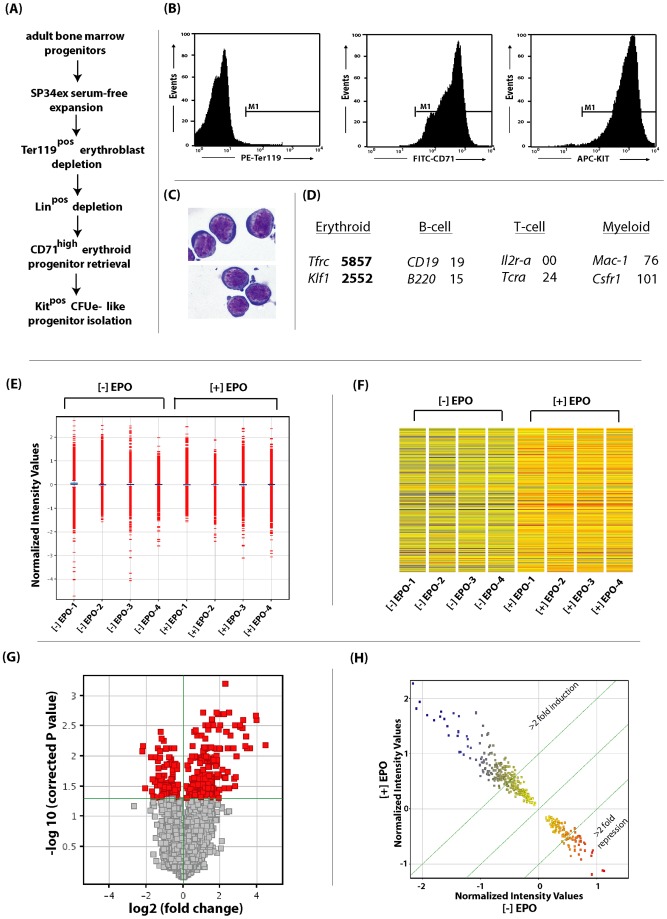
Figure 1. Defining the EPO/EPOR- regulated transcriptome in primary bone marrow CFUe-like erythroid progenitor cells.
A] Short term expansion of primary bone marrow erythroid progenitors, and isolation of a CFUe- like cohort – Approaches employed for the expansion and purification of KitposCD71highTer119neg stage E1 progenitor cells are outlined. B, C] For isolated stage E1 cells, flow cytometric features are illustrated, together with representative May-Grumswald cytospin preparations. D] For CFUe-like progenitors (stage E1) purity also was assessed based on initial overall transcriptome profiling (n = 3 per stage), with relative mean expression intensities illustrated for select erythroid (Tfrc, Klf1), lymphoid (CD19, B220, IL2r-a, Tcr-a) and myeloid (Mac1, Csfr1) marker transcripts. E] Distributions and variance of overall hybridization signal intensities among control and EPO- challenged treatment groups. F] Heat-map signatures of expressed transcripts (for all independent quadruplicate samples) for [−] EPO vs [+] EPO exposed CFUe-like stage E1 progenitors. Here, a fold cut-off of >1 was used, and signal strengths for 365 transcripts (probe sets) are illustrated. G] In this volcano plot, the dividing line (and vertical color-code) denote significant p-values (0.05 cut-off) for EPO- modulated transcripts (−log10 ordinate scale). The x-axis displays transcripts based on their fold-change due to EPO (log2 scale). H] Overall scatter plot of significantly modulated EPO/EPOR- response genes.

