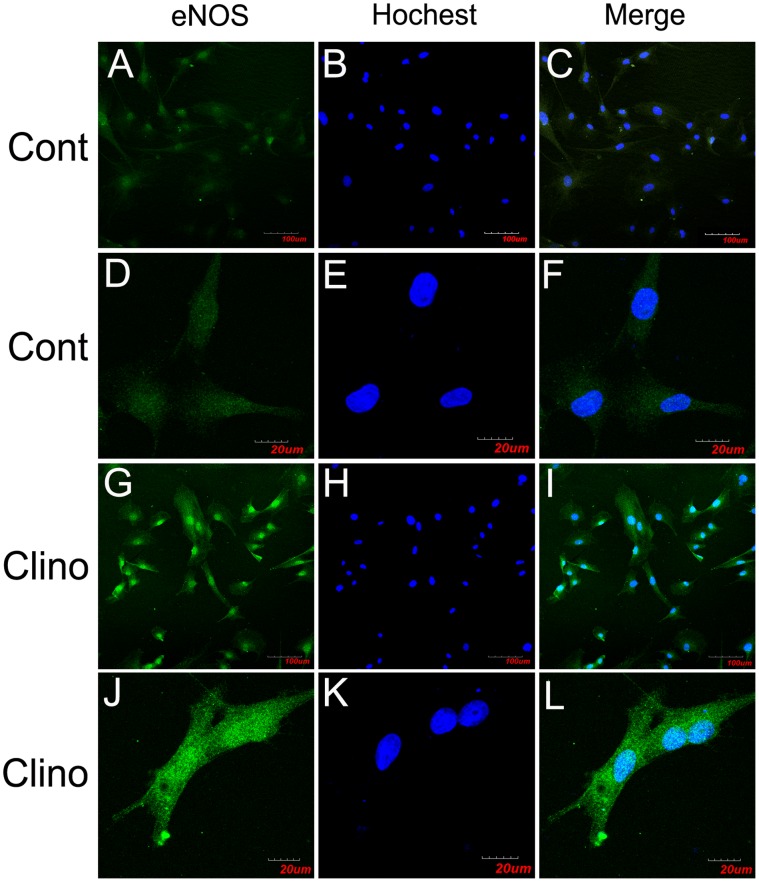
Figure 5. Simulated microgravity increases eNOS expression in HUVEC-C.
Confocal microscopy localization of eNOS (Alexa-488, represented in green) in HUVEC-C exposed to 24 h of (A–F) normal gravity or to (G–L) simulated microgravity. Color images result from integrating different optical sections. The images in (A–C) and (G–I) were obtained by using the ×10 air objectives, and those in (D–F) and (J–L) were obtained by using the ×60 water immersion objectives. The images in (A–C) and (G–I) show high numbers of cells, but this in (D–F) and (J–L) show few cells.(C, F, I, L) Superposition of the green (eNOS) and blue (nucleus) signals.

