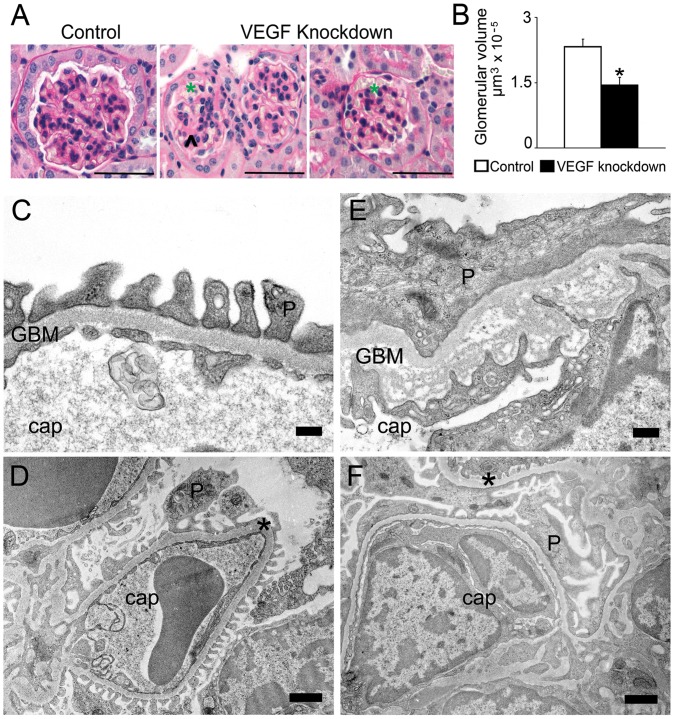
Figure 3. VEGF knockdown glomerular phenotype.
(A) PAS stain shows mesangiolysis (arrowhead), microaneurisms (green asterisk) and decreased glomerular volume in VEGF-A knockdown glomeruli, scale bars = 50 µm. (B) Quantitation of glomerular volume reveals that VEGF knockdown induces significant decrease in glomerular size. * indicates P<0.05 vs. control. (C-D) TEM: control glomeruli show normal ultrastructure; scale bars = 200 nm (C) and 1 µm (D). (E-F) TEM: VEGF knockdown glomeruli show endothelial cell swelling, vacuolization and decreased fenestration; GBM lamination of the lamina densa, irregular thickening and interdigitations of the endothelium; podocyte foot process effacement; scale bars = 500′nm (E) and 1 µm (F). Cap = capillary, P = podocyte, * = GBM.

