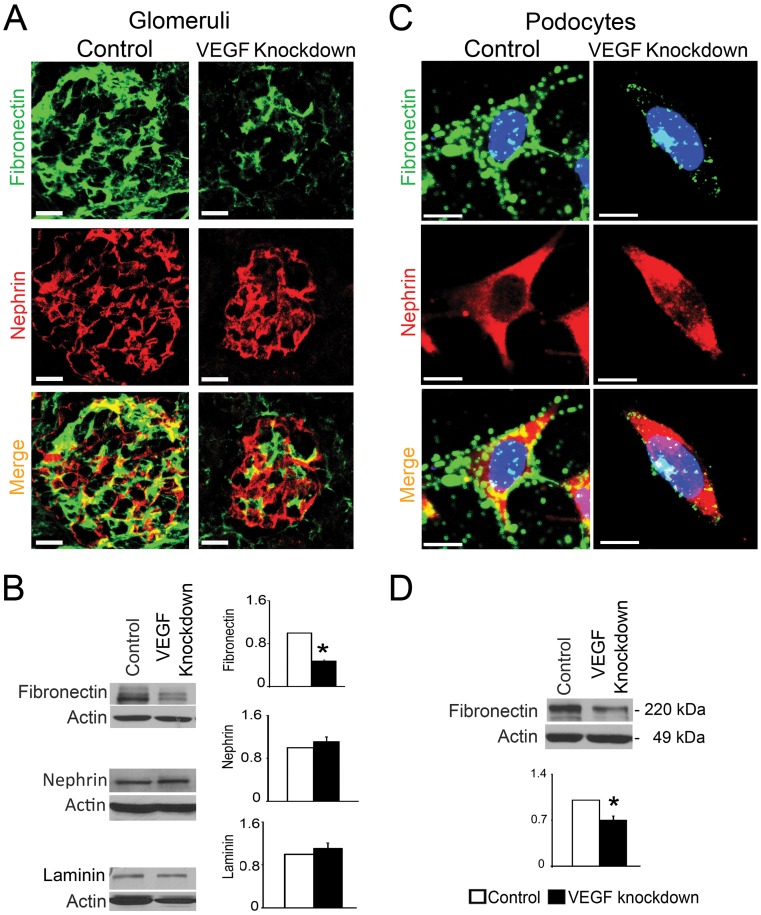
Figure 5. VEGF knockdown downregulates fibronectin expression.
(A) IHC: VEGF knockdown glomeruli show marked decrease in immunoreactive fibronectin, while nephrin expression is unchanged. Scale bar = 20 µm (B) Representative immunoblots show decreased fibronectin in VEGF knockdown kidney lysate, whereas nephrin and laminin expression levels are similar to controls. (C) ICC: Fibronectin expression decreases in doxycycline-induced VEGFKD podocytes, while nephrin does not change. (D) Representative immunoblot shows fibronectin downregulation in induced VEGFKD podocytes, scale bars = 10 µm. In (C) and (D) bar graphs show densitometric analysis, data are expressed as mean±SEM fold change in arbitrary units as compared to controls, n≥3, * indicate P<0.05 vs. control.

