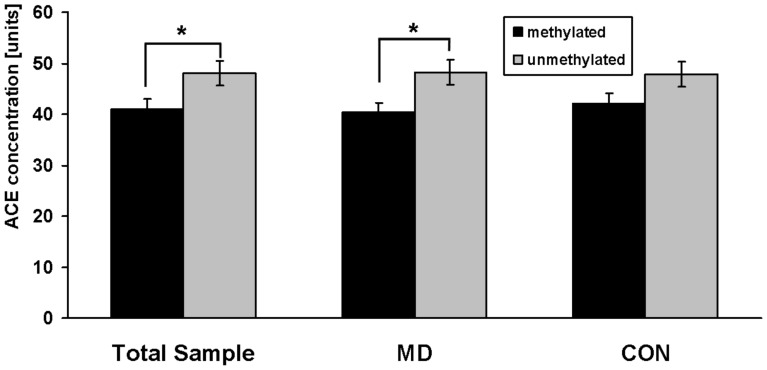
Figure 3. ACE serum concentrations (baseline) among the total sample, medication-free depressive patients (MD) and controls (CON) in relation to their methylation status in the (−456/−255) region of the ACE gene.
Methylated probes showed lower ACE concentrations (p = 0.005, F = 8.1). This effect was also obvious in depressive patient (p = 0.03, F = 5.1). In the control group there was a similar pattern, but without statistical significance. *: p<0.05 (ANCOVA). Data are mean values ± s.e.m.

