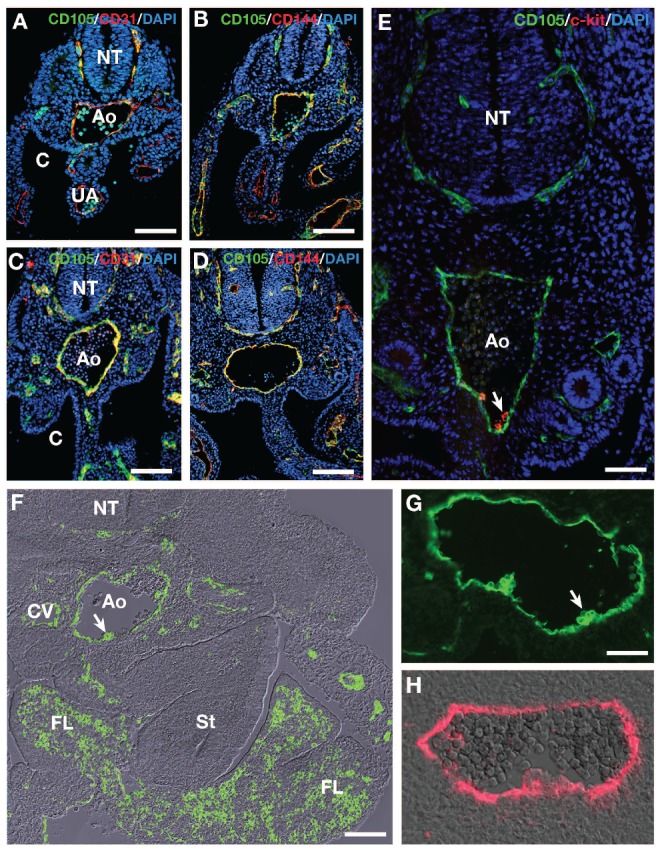
Figure 1.

Immunofluorescence analysis of CD105, CD31, CD144 and c-kit expression in the mouse (A-G) AGM before and at the time of hematopoiesis and CD105 expression in the human AGM (H). (A and C) CD105/CD31/DAPI. (B-D) CD105/CD144/DAPI. (E) CD105/c-kit. Immunohistochemistry. Cross sections. (A and B) E9 embryos. Both CD31 (A) and CD144 (B) are co-expressed with CD105 in endothelial cells, as testified with the yellow color resulting from the overlay. Bar=30 μm C, (D) E10 embryos. Coexpression is similar to that seen at E9. Bar=50 μm. (E) E10 embryo. CD105 and c-kit are co-expressed at the level of the clusters. Bar=30 μm. (F) E11 mouse embryo; cross section. CD105 immunofluorescence merged with dichroic bright field. The signal is restricted to the endothelium and to hematopoietic cells of the fetal liver and the AGM. The white arrow points to a hematopoietic cluster in the aortic floor. Bar=100 μm. Ao: aorta; C: coelom; CV: cardinal vein; FL: fetal liver; NT: neural tube; St: stomach; UA: umbilical artery. (G) E11 mouse embryo; CD105 immunofluorescence. Close view of the aorta and hematopoietic clusters. The two hematopoietic cluster-composing cells display a variable level of CD105 expression. Bar=20 μm. (H) 30 day-old human embryo; cross section; CD105 immunofluorescence merged with dichroic bright field. A variable level of expression is also visible in the hematopoietic cluster. Bar=30 μm.
