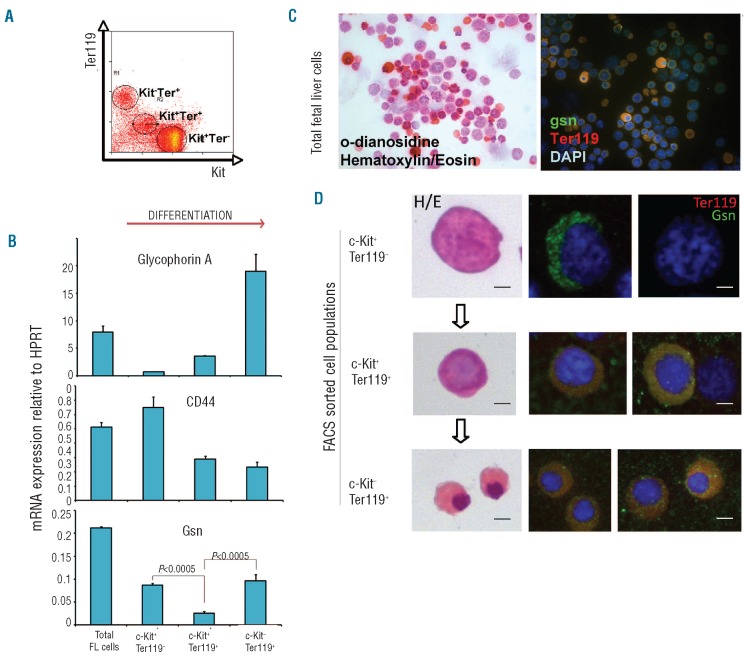
Figure 1.
Characterization of gelsolin expression during erythroid maturation. (A) FACS analysis of E13.5 mouse fetal liver cells for expression of c-Kit and Ter119 cell antigens. The three major cell populations are indicated. (B) Real-time PCR on Gsn, GpA and CD44 expression on cDNA from the sorted fetal liver cell populations indicated in (A) FL: cDNA from total fetal liver cells. Histograms show the levels of expression (mean SEM of at least 3 independent experiments) relative to hypoxanthine-phospho-ribosyltransferase (HPRT) considered as 1. Statistical significance is indicated above the chart. (C) Fetal liver cells cells were stained with O-dianosidine (bright orange) and counterstained with hematoxylin/eosin. Immunofluorescence analysis using an anti-Gsn antibody (green), an anti Ter119 antibody (red) and DAPI (blue). Bar: 25 μm. (D) The same analysis was carried out on FACS sorted cell populations. Single cells are shown as an example. Bars: 4 μm.

