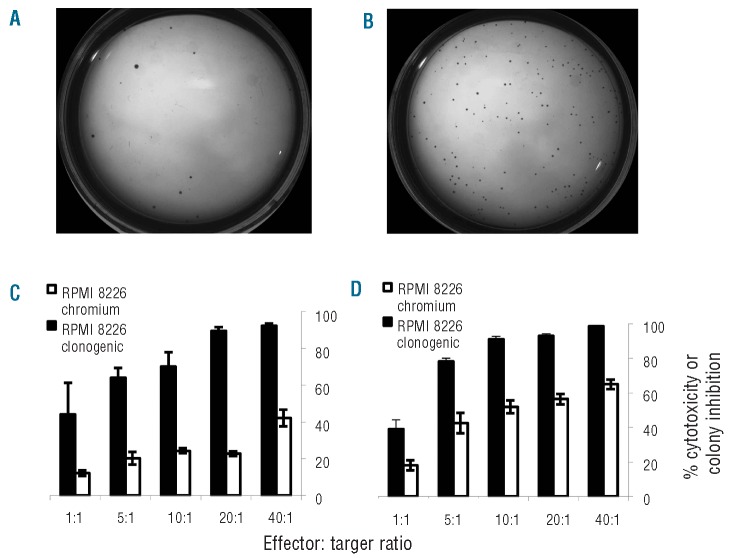
Figure 3.
Representative methyl-cellulose colony growth at two weeks. (A) RPMI 8226 MM cell lines treated with KHYG-1 at a 20:1 E:T ratio. (B) Low density control: MM cells and NK cells incubated separately then co-injected into methylcellulose. Preferential killing of the clonogenic fraction of MM cells detected in a methylcellulose cytotoxicity assay (black) compared to bulk killing detected in a chromium release assay (white) by NK cell lines. (C) Preferential killing of clonogenic RPMI 8226 cells by NK-92. (D) Preferential killing of clonogenic RPMI 8226 cells by KHYG-1.

