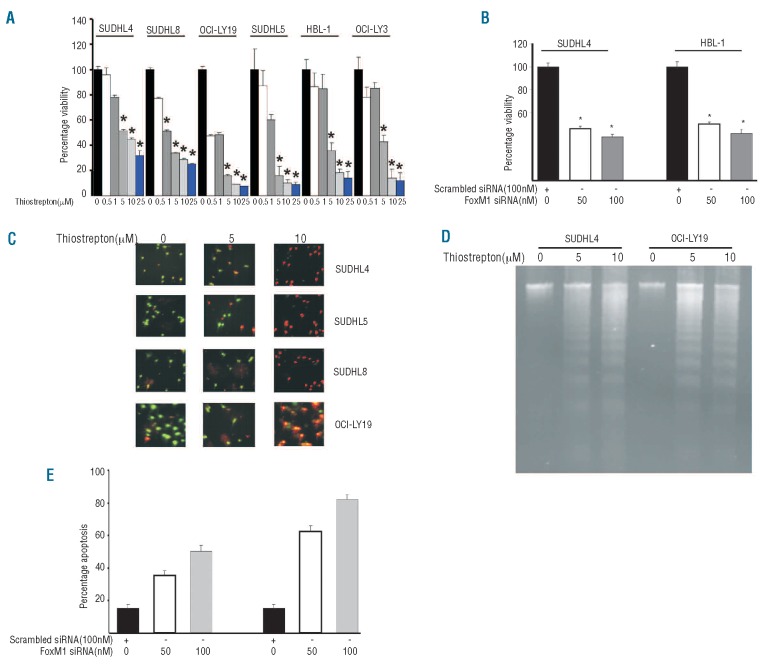
Figure 2.
Downregulation of FoxM1 expression leads to inhibition of cell viability and induction of apoptosis in DLBCL cell lines. (A) DLBCL cells were incubated with 0.5, 1, 5, 10 and 25 μM thiostrepton for 48 h. Cell viability was assayed using MTT as described in Design and Methods section. The graph displays the mean ± SD (standard deviation) of 3 independent experiments with replicates of 6 wells for all the doses and vehicle control for each experiment * P<0.05, statistically significant (Student’s t-test.) (B) SUDHL4 and HBL-1 cells were transfected with scrambled siRNA or FoxM1 specific siRNA for 48 h. Following treatment, cell viability was measured by MTT. The graph displays the mean ± SD (standard deviation) of 3 independent experiments with replicates of 6 wells for all the doses and vehicle control for each experiment *P<0.05, statistically significant (Student’s t-test.) (C) SUDHL4, SUDHL5, SUDHL8 and OCI-LY19 cells were treated with 5 and 10 μM thiostrepton for 48 h and apoptosis was measured by Live/Dead Assay. (D) Thiostrepton-induced apoptosis detected by DNA laddering. DLBCL cells were treated with 5 and 10 μM thiostrepton (as indicated) for 48 h and DNA was extracted and separated by electrophoresis on 1.5% agarose gel. (E) SUDHL4 and HBL-1 cells were transfected with scrambled siRNA or FoxM1 specific siRNA for 48 h. Following treatment, cells were subsequently stained with flourescein-conjugated annexin-V and propidium iodide (PI) and analyzed by flow cytometry. Bar graph denotes standard deviation of 3 independent transfections.

