Figure 1.
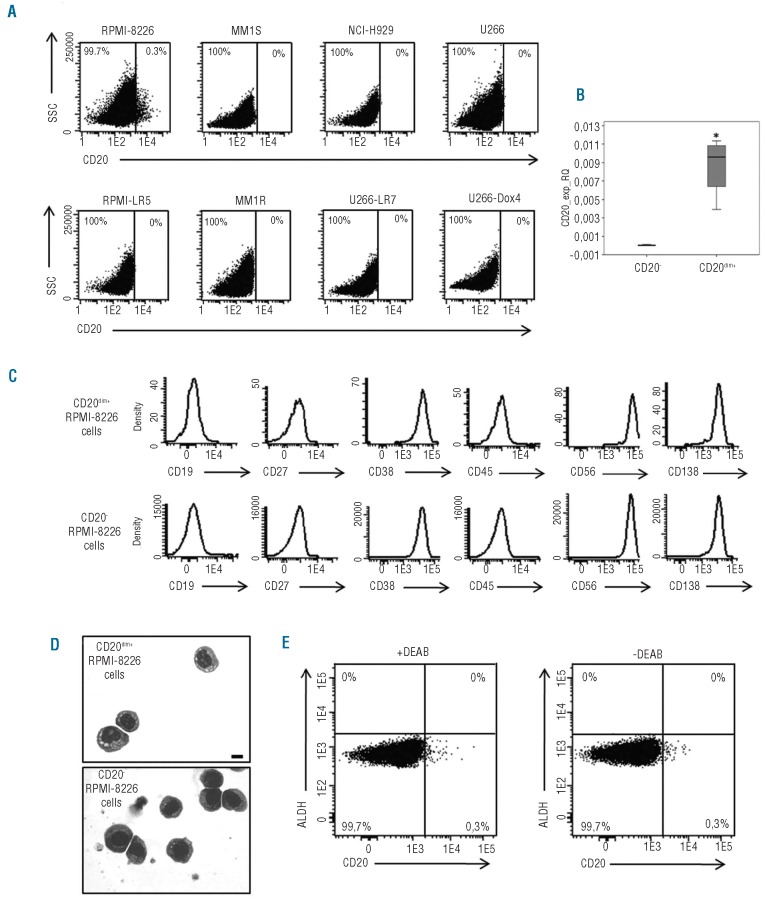
Study of CD20 expression in MM cell lines and characterization of the phenotype and the morphology of CD20dim+ and CD20− RPMI-8226 cells. (A) Bivariate dot plots showing the percentage of expression of CD20+ and CD20− cells in the RPMI-8226, MM1S, NCI-H929, U266, RPMI-LR5, MM1R, U266-LR7 and U266-Dox4 MM cell lines. (B) Expression of CD20 by real-time quantitative PCR in CD20− and CD20dim+ RPMI-8226 cells. Relative values were calculated by the 2−ΔCt method (ΔCt = Ct(Gene)− Ct(GAPDH)). The GAPDH gene was used as a control gene. Significance is expressed as *P<0.05 (Mann-Whitney U test). (C) Single parameter histograms illustrating the expression of CD19, CD27, CD38, CD45, CD56 and CD138 in CD20dim+ and CD20− RPMI-8226 cells. (D) May-Grünwald-Giemsa staining of CD20dim+ and CD20− RPMI-8226 cells. Cells were visualized with an Olympus BX51 microscope (Olympus, Japan). Images were captured with an Olympus DP70 camera (Olympus, Japan) using the software DP controller. Scale bar 10 μm. (E) Bivariate dot plots representing CD20 expression (x axis) versus ALDH expression (y axis) in the presence or absence of the ALDH-inhibitor, diethylaminobenzaldehyde (DEAB). The percentage of cells within each electronic gate is indicated.

