Abstract
Purpose: To develop a new fully four-dimensional (4D), iterative image reconstruction algorithm for cardiac CT that alternates the following two methods: estimation of a time-dependent motion vector field (MVF) of the heart from image data and reconstruction of images using the estimated MVF and projection data.
Methods: Volumetric image data at different cardiac phase points were obtained using electrocardiogram-gated CT. Motion estimation (ME) and motion-compensated image reconstruction (MCR) were performed alternately until convergence was achieved. The ME method estimated the cardiac MVF using 4D nonrigid image registration between a cardiac reference phase and all the other phases. The nonrigid deformation of the heart was modeled using cubic B-splines. The cost function consisted of a sum of squared weighted differences and spatial and temporal regularization terms. A nested conjugate gradient optimization algorithm was applied to minimize the cost function and estimate the MVFs. Cardiac images were reconstructed using a motion-tracking algorithm that utilized the MVFs estimated by the ME method. The reconstructed images supplied the input to the ME of the next iteration. The performance of the proposed method was evaluated using four patient data sets acquired with a 64-slice CT scanner. The heart rates of the patients ranged from 52 to 71 beats/min.
Results: Motion artifacts were significantly reduced, and the image quality increased with the number of iterations. Without MCR, the right coronary artery (RCA) was deformed into an arc in axial images of rapid phases. With the proposed method the RCA appeared sharper and was reconstructed similar in shape to the reconstruction at the quiescent phase at mid-diastole. The boundary between the interventricular septum and the right ventricle was also clearer and sharper using the proposed algorithm. The steepness of the transition range at a rapid phase (35% R-R) was increased from 6.8 HU/pixel to 11.5 HU/pixel. The ME-MCR algorithm converged in just four iterations.
Conclusion: We developed a fully 4D image reconstruction method that alternates ME and MCR algorithms in an iterative fashion. Performance tests using clinical patient data resulted in reduced motion artifacts.
Keywords: motion artifacts, motion estimation (ME), motion-compensated reconstruction (MCR), sum of squared weighted differences
INTRODUCTION
Cardiovascular diseases remain the leading cause of death in the western world, placing an ever-increasing burden on both private and public health services. Electrocardiogram (ECG)-gated cardiac computed tomography (CT) imaging is a promising noninvasive technique for early detection of fatty vulnerable plaque in coronary arteries. However, there are two major problems with the current retrospectively ECG-gated image reconstruction technique: large patient radiation dose and insufficient temporal resolution, leading to sometimes severe motion artifacts. In the past five years, significant technical efforts have been made including ECG-triggered (or prospectively ECG-gated) sequential scan modes,1 to decrease radiation dose and to overcome arrhythmia and irregular heart rates. This scan mode with 64- or 128-row detectors allows to complete the cardiac scan within several heart beats, while decreasing the out-of-phase radiation dose for low-dose scan and adjusting the scan flexibly for arrhythmia and irregular heart rates.2, 3
Current solutions to these problems have certain limitations. Prospectively, ECG-gated helical scanning (a.k.a., ECG-pulsing) or sequential scan is a typical solution to the dose issue, which reduces or turns off the x-ray flux for cardiac phases that are outside the window of interest.1 However, this technique has the following complications: (1) the user has to identify the patient-specific optimal phase with respect to the ECG signals; (2) the heart rate must be stable during the scan if the helical mode is employed; (3) the motion of the heart, which contains useful clinical information, cannot be obtained unless data over the entire heartbeat are acquired, which will significantly increase the dose. Therefore, retrospectively ECG-gated cardiac CT is still commonly used. Solutions to the temporal resolution include faster gantry rotation speed and dual-source CT.4 However, these hardware-based solutions increase the cost of the scanner.
A different, algorithm-based approach to reducing motion artifacts is to incorporate information about the cardiac motion into the reconstruction process.5, 6, 7, 8, 9, 10, 11, 12 By compensating for the motion the acquired projection data can be fully utilized for image reconstruction. Motion compensated reconstruction (MCR) has the additional potential benefit to improve myocardium perfusion CT.13
In this paper, we propose a fully four-dimensional (4D), iterative image reconstruction algorithm that alternates motion estimation (ME) and MCR. The ME method utilizes an image-based registration procedure, and we adapt Schäfer's motion tracking cone-beam backprojection method6 for MCR. The iterative process is terminated when the improvement in image quality becomes negligible.
Recently, Isola et al.12 developed an image-based ME method to estimate 4D cardiac motion. The authors used gated cardiac CT images and selected a set of quiescent phases during one heartbeat, one of which was chosen as an anchor phase. Next, 3D nonrigid image registration was performed to obtain 3D motion vector fields (MVFs) between the anchor phase and all other quiescent phases. Cubic B-spline interpolation was applied to obtain the 4D MVF between any phase point during the cardiac cycle and the anchor phase. Finally, vector field inversion and composition were used to compute the 4D MVF between a rapid phase of interest and another, arbitrary phase point.
In contrast, our ME approach is a 4D nonrigid image registration method which directly estimates 4D MVFs, fully utilizing the volume images at all cardiac phases.14 Temporal regularization is applied as well as a spatial regularization in the cost function to ensure that the estimated 4D MVF is smooth in both time and space. The weighting factor of the temporal smoothness term varied with respect to the cardiac phase, and stronger regularization was applied to faster cardiac phases to reduce severe motion artifacts.
There are two main classes of MCR algorithms: numerical or iterative methods12 and analytical methods.6, 15, 16, 17, 18 Iterative MCR methods typically have large memory and computational requirements. Considering the additional computational burden, they are not suitable for our iterative ME-MCR. Also, it has been shown that iterative methods may present artifacts due to subtle inconsistencies in clinical data unless extra precautions are taken.19 Consequently, we chose an analytical method for our study. Several analytical MCR methods require motion models15, 16, 17, 18 but do not utilize the MVFs directly. Here, we adapted a motion tracking cone-beam backprojection method6 which is efficient and can be easily implemented with MVFs.
The structure of this paper is as follows. In Sec. 2, we outline the ME method, the MCR method, and the iterative ME-MCR algorithm. In Sec. 3, the performance of the proposed method is evaluated using clinical cardiac CT data. Relevant issues are discussed in Sec. 4, followed by conclusions.
ALGORITHMS
In this section, we outline the ME method, the MCR method, and the iterative ME-MCR algorithm.
ME algorithm
The ME algorithm was developed in our previous work,14 which is briefly described here for convenience. Zeng et al.20 proposed a projection-based ME approach that maximizes a regularized similarity metric between the measured and calculated projection data by solving an optimization problem. We modified their approach to an image-based ME and obtained 4D MVFs, , where is a 3D spatial vector. The deformation vector is defined from a cardiac reference phase tr to another phase t.
Deformation model
An image volume at a quiescent motion phase was chosen as reference and an image at phase t was obtained by warping the reference image as follows:
| (1) |
The deformation was modeled by a finite number of knots using cubic B-splines as
| (2) |
where and Δt are the knot spacing in the spatial and temporal domain respectively, and τ are discrete sampling indices in the spatial and temporal domain respectively, are the cubic B-spline coefficients, K is the number of knots in time, b is a 1D cubic B-spline, and β is a 3D tensor product of cubic B-splines.
Cost function
The deformation parameters were estimated by minimizing a regularized weighted least-squared difference between the warped reference volume and the target volumes
| (3) |
| (4) |
where denotes a similarity metric
| (5) |
and denotes a quadratic penalty term
| (6) |
In Eq. 5, N is the number of voxels in a 3D image, m is a phase index, M is the number of discrete phase points in one heart beat at which images were reconstructed, and is a weighting function. In Eq. 6, S is the number of 4D knots, αx and αt are weighting factors for the spatial and temporal smoothness terms respectively, and Cx and Ct are differencing matrices in the spatial and temporal domains, respectively. The number of knots in time was chosen to be the same as the number of discrete time points, K = M.
Optimization
We used an iterative nested conjugate gradient (CG) algorithm to minimize the cost function . The conjugate gradient method was chosen because it typically provides fast convergence and does not require inversion of the Hessian matrix. To avoid calculating a very large Hessian matrix, updates in the inner loop of the nested algorithm were calculated in subsets of the B-spline coefficients. A subset contained B-spline coefficients that were related to a specific 3D MVF from the reference phase tr to another phase tm, m = 1, …, K. Each subset was updated exactly once in the inner loop, and the estimations were obtained from the current estimations using the following update:
| (7) |
where
| (8a) |
| (8b) |
| (8c) |
Here, T is the transpose operator, k is the iteration number, was evaluated at , and was evaluated at , which is similar to Zeng's derivation.18 This procedure was iterated until the updates were small. To save computation time, the Hessian matrix A was updated every five iterations.
MCR algorithm
We adapted Schäfer's motion tracking cone-beam backprojection method6 for helical halfscan21 and reconstructed volumes at cardiac phases tm. Schäfer's method simply traces the motion of each voxel during the backprojection process. However, it is a very good approximation of an exact compensation method when the object deformation can be described by an affine transformation such as isotropic scaling (contraction and expansion), rotation, and translation.22 The method is almost identical to the standard Feldkamp algorithm,23 except that during the backprojection process a ray that corresponds to a new pixel location, , is chosen with the inverse squared-distance weight calculated by the new pixel location. Both ends of the cardiac time window were feathered similar to a previous method,24 but the projection range was fixed.
The MCR process required to estimate the MVFs from the phases tm to an arbitrary, continuous phase t, which in general was different from the K discrete phases for which MVFs were estimated as described in Sec. 2A. The vector fields were obtained using inversion, concatenation, and interpolation of the existing MVFs as follows. First, we inverted the MVF from phase tr to tm, , and obtained the MVF from tm to tr,
| (9) |
using a fixed-point-based iterative method.25 Then, we obtained MVFs from tm to all other discrete cardiac phases tn, n = 1, …, K by concatenating and ,
| (10) |
Finally, the motion vectors were obtained by cubic B-spline interpolation on the discrete set of MVFs as
| (11) |
ME-MCR algorithm
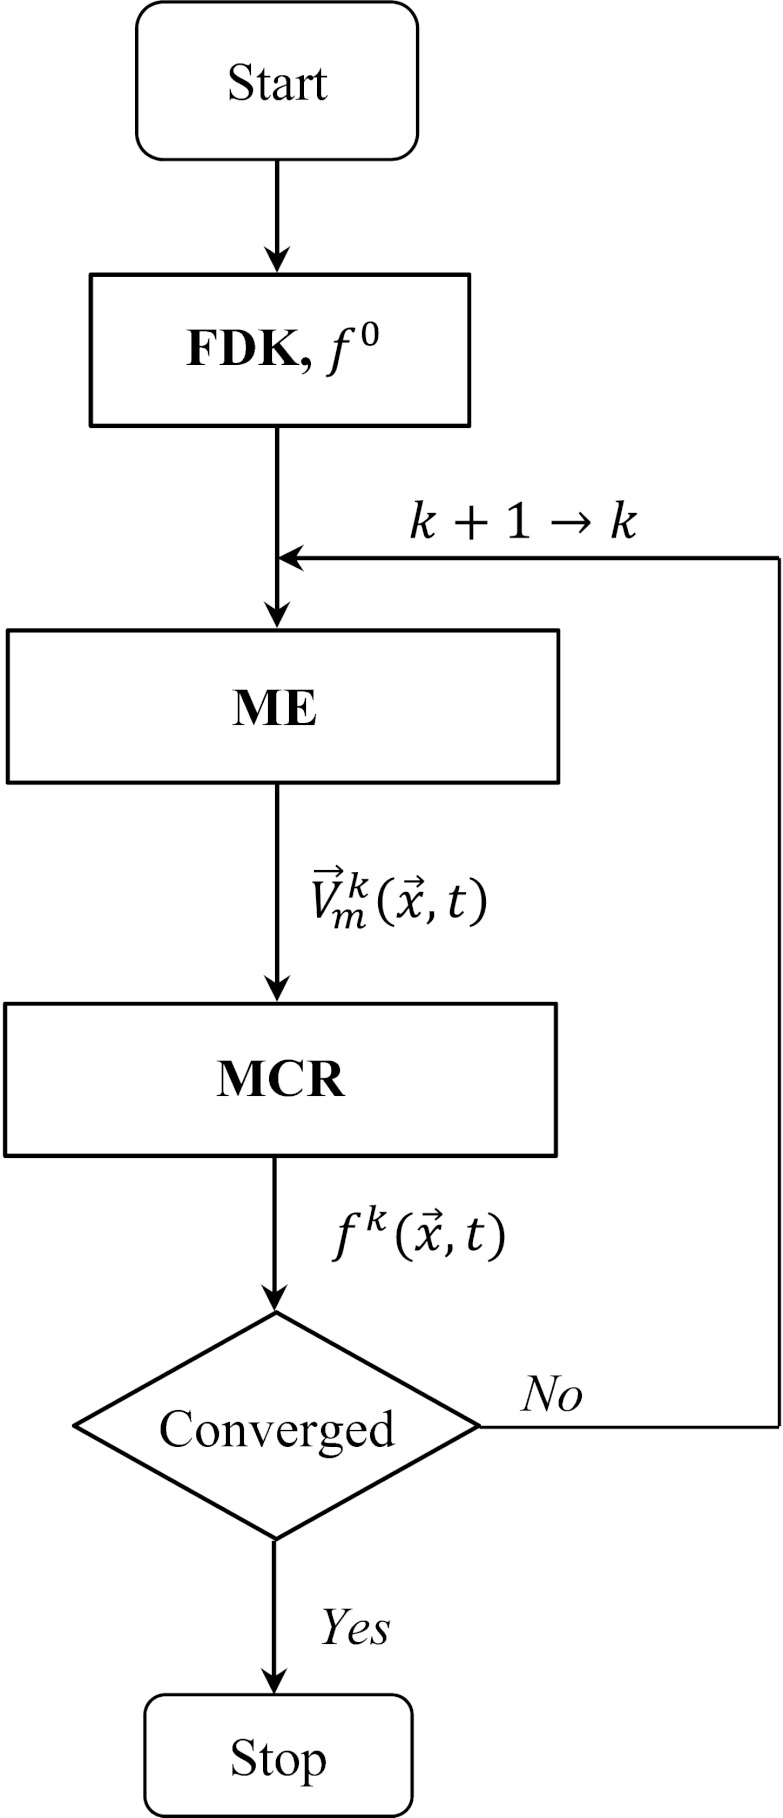
The general framework of the proposed ME-MCR method was similar to that of Gilland et al. which was developed for nuclear medicine.26, 27 The iteration started with a set of images reconstructed from ECG-gated helical, half-scan data using the Feldkamp algorithm. The superscript “0” indicates the initial iteration step. The two independent algorithms for ME and MCR were performed alternately in one loop of the iterative process. The iteration ended once the change from one reconstructed images to the next iteration step became small. The ME-MCR algorithm can be summarized as follows (see also Fig. 1):
Figure 1.
Flowchart of the proposed ME-MCR method.
Step 1: k = 0: Reconstruct at all phases tm using the Feldkamp algorithm and choose a reference phase tr.
Step 2: k+1 → k: Estimate MVFs from the reference phase to all other phases.
Step 3: Calculate MVFs , from phase tm toward arbitrary phase t.
Step 4: Reconstruct by the MCR method using .
Step 5: Repeat steps 2–4 while the mean absolute difference is greater than a stopping criteria ɛ.
EVALUATION
The proposed algorithm was implemented using C and the CUDA programming platform to accelerate the computation on a graphic processing unit (GPU) board. The performance of the algorithm was evaluated with cardiac CT patient data.
Methods
Projection data of four patients were acquired with a 64-slice CT scanner (Sensation 64, Siemens Healthcare, Forchheim, Germany) following a standard cardiac protocol. The detector collimation was 2 mm × 32 mm × 0.6 mm with z-flying focal spot, the helical pitch was 0.29 per rotation, the gantry rotation speed was 330 msec per rotation, and the number of projections per rotation was 1160. The ECG signals were acquired during the scan.
The mean heart rate ranged from 52 to 71 beats/min as detailed in Table 1. The cardiac cycle was divided into 20 phases corresponding to increments of 5% in the R-R interval. The image volume at a single phase consisted of 512 × 512 × nz voxels, with nz varying between 241 and 321 slices, and the spacing was 0.43 mm × 0.43 mm × 0.50 mm. The MVF was modeled using B-splines with 16 × 16 × 11 knots in the x, y, and z axes, and 20 knots in the temporal axis. The knot spacing was Δx = 14.6 mm, Δy = 14.6 mm, Δz =12.0–16.0 mm. The quiescent cardiac phases with least motion were determined manually as 5% of the R-R interval (end-diastole), 40% (end-systole), and 75% (mid-diastole) for all four patients. These three quiescent cardiac phases were chosen as reference phases, and three sets of 4D MVFs (one for each reference phase) were estimated independently.
Table 1.
Parameters of the patient data sets: Size of reconstructed image volumes, average heart rate (HR), standard deviation (STD) of the HR, minimum HR, maximum HR, and contrast. The contrast scores (10, best contrast; 1 worst contrast) were assigned by the authors by visually inspecting the patient images.
| HR | HR | |||||
|---|---|---|---|---|---|---|
| Volume size | average | STD | HRmin | HRmax | Contrast | |
| Patient 1 | 512 × 512 × 289 | 51.7 | 3.0 | 47.1 | 58.3 | 10 |
| Patient 2 | 512 × 512 × 245 | 56.3 | 3.0 | 50.2 | 61.2 | 8 |
| Patient 3 | 512 × 512 × 321 | 52.2 | 4.2 | 48.2 | 64.0 | 6 |
| Patient 4 | 512 × 512 × 241 | 70.7 | 9.2 | 59.3 | 97.1 | 6 |
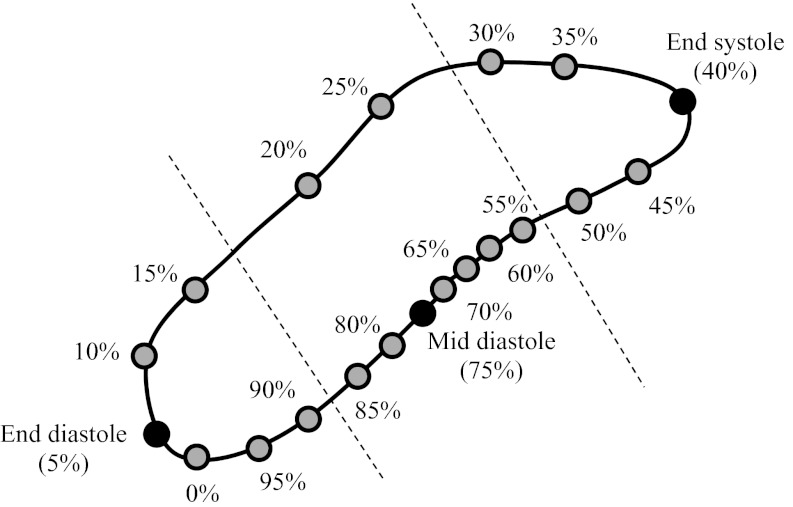
Estimating large motion deformations is challenging for nonrigid image registration and may lead to unrealistic motion patters such as folding. Several quiescent phases were determined and used as reference phases, which is similar to what Schirra et al. proposed.10 In their approach, phase points from quiescent phases were grouped together into quiescent segments and one phase point from each segment was chosen as a reference phase. The 3D image registration was performed between each reference phase and all other phases in the same quiescent section and between all reference phases. The motion vector field between arbitrary phase points was finally obtained by temporal interpolation of the motion fields between quiescent segments. In contrast, our proposed method performed 4D image registration between each reference phase and all other cardiac phases. Therefore, three sets of motion vector fields were obtained. For the MCR the cardiac cycle was divided into three parts, corresponding to the three quiescent reference phases. Each of the 17 remaining phases was assigned to the reference phase that was closest in space. Spatial closeness was defined by the trace of the right coronary artery (RCA) as shown in Fig. 2. During MCR at a target phase t, only the MVFs that were estimated for the reference phase in the same group were used. As an example, for the target phase t = 15% R-R only the MVFs from end-diastole to all other phases were used, and for the target phase t = 25% R-R only the MVFs from mid-diastole to all other phases were used. This division into three parts provided the most accurate MVFs for each target phase.
Figure 2.
Motion path of the right coronary artery. The reference phases (solid black dots) are chosen at mid-diastole (75% R-R), end-diastole (5% R-R), and end-systole (40% R-R). The two dashed lines divide the cardiac phase into three groups. In each group, there is one reference phase and 5, 8, and 4 target phases (for end-diastole, mid-diastole, and end-systole, respectively). Only MVFs between reference phases and target phases of the same group were used for reconstruction.
The four patient data sets were selected based on visual inspection in order to present different scenarios to the ME-MCR algorithm. For patient 2, all three reference phases showed few motion artifacts. Patient 1 showed one motion free reference phase (mid-diastole, 75% R-R) and patient 3 showed two motion free reference phases (end-systole, 40% R-R and mid-diastole, 75% R-R). Patient 4 showed motion blurring in all three reference phases.
The weighting factor for spatial smoothness in the ME algorithm, parameter αx in Eq. 6, was set to a value of 8.0 and the weighting factor for temporal smoothness, αt, varied with the cardiac phase as described in Ref. 14. The iteration of ME and MCR was stopped when the MAD between reconstructed images of consecutive iteration steps was smaller than 2.5 HU.
Results
We discuss the results of the ME-MCR algorithm separately for each patient data set.
A case with one clear and two blurred reference phases (patient 1)
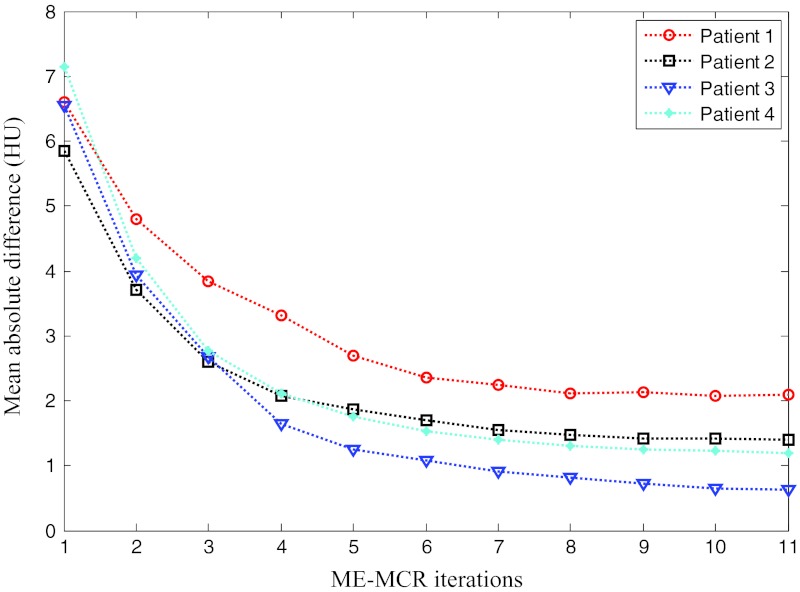
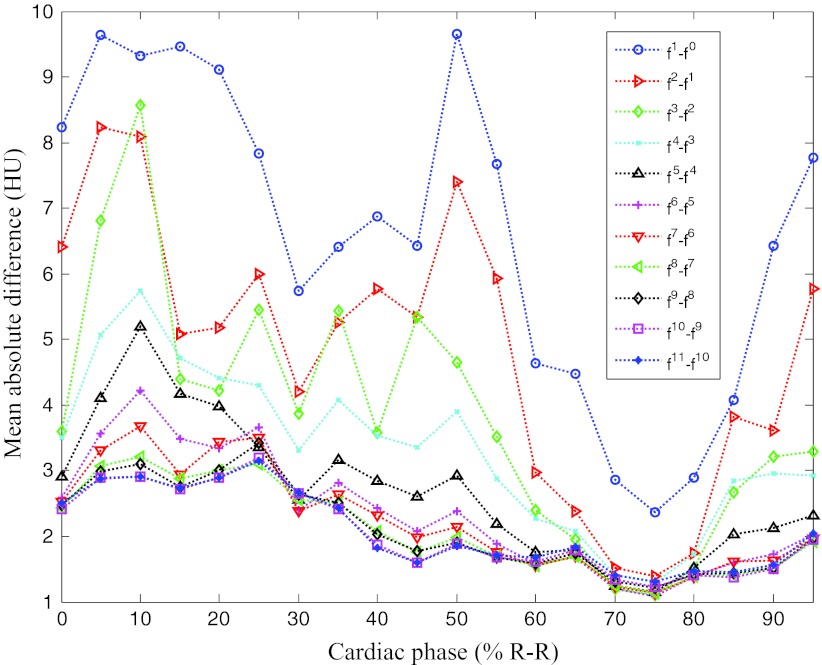
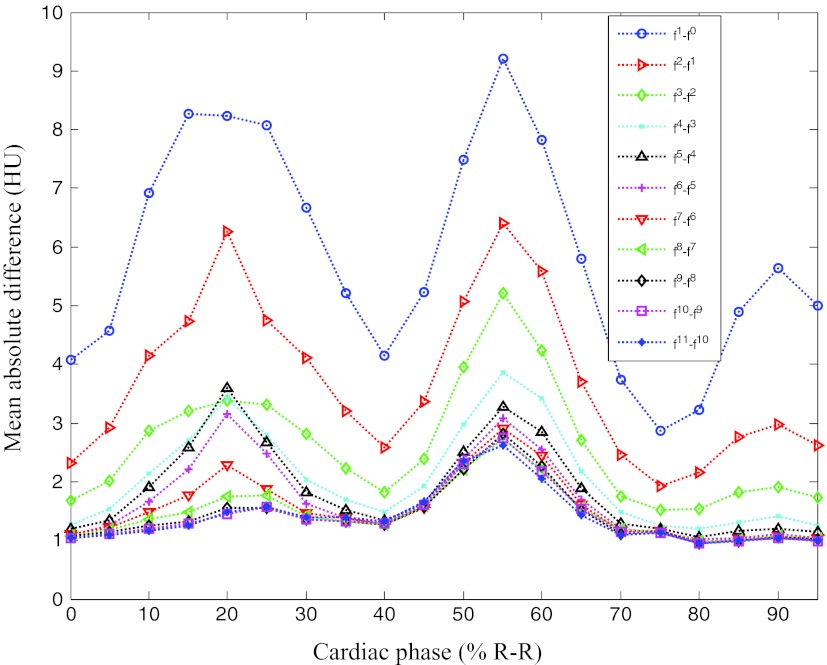
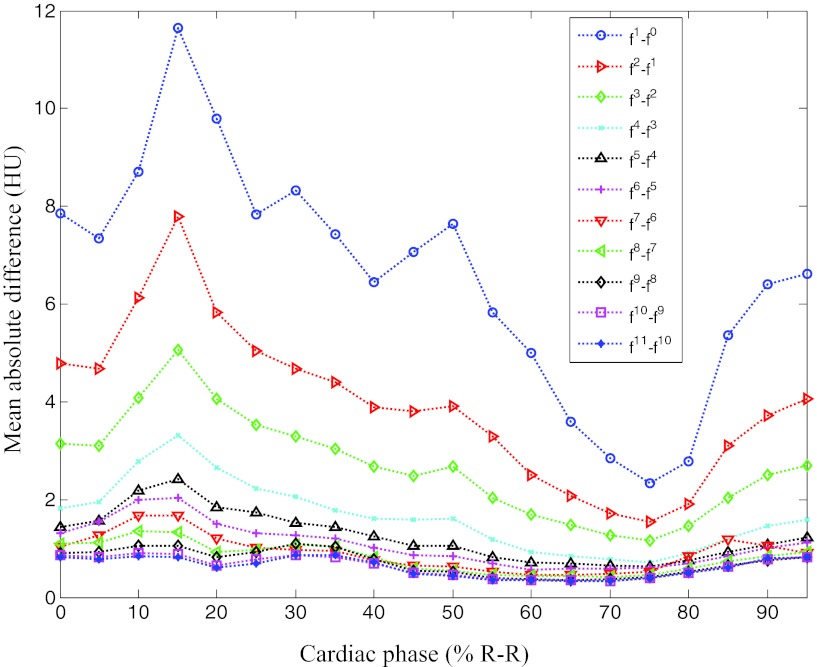
First, we outline the performance of the proposed method in detail using a case with one clear and two blurred reference phases. Figures 34 show the overall change of the images with the iterative ME-MCR method. Figure 3 shows the MAD between the 4D volume images at the current and the previous iteration. The MAD values decreased as the ME-MCR iteration progressed and the change in Hounsfield units became small. Figure 4 shows the MAD between the images at the current and the previous iterations separately for each cardiac phase. The MAD values decreased for all cardiac phases, although the degree of improvement depended on the phase. The MAD of some phases did not decrease monotonically. The MAD for all phases continued to decrease after the 4th iteration, and the image quality did not seem to be different subjectively.
Figure 3.
Mean absolute difference of 4D image as a function of iteration numbers for all patients.
Figure 4.
Mean absolute difference varying with iteration number and cardiac phase for patient 1.
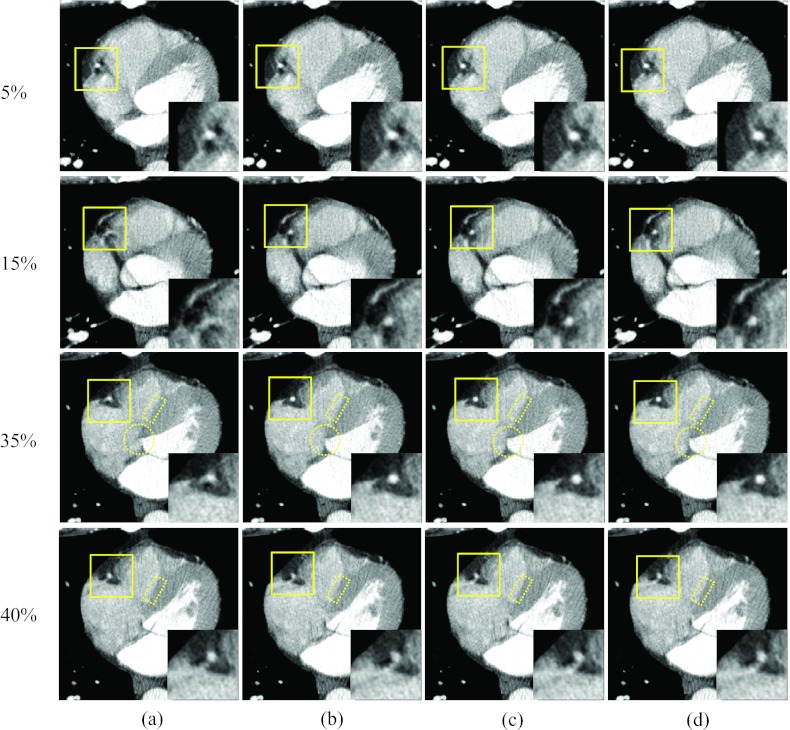
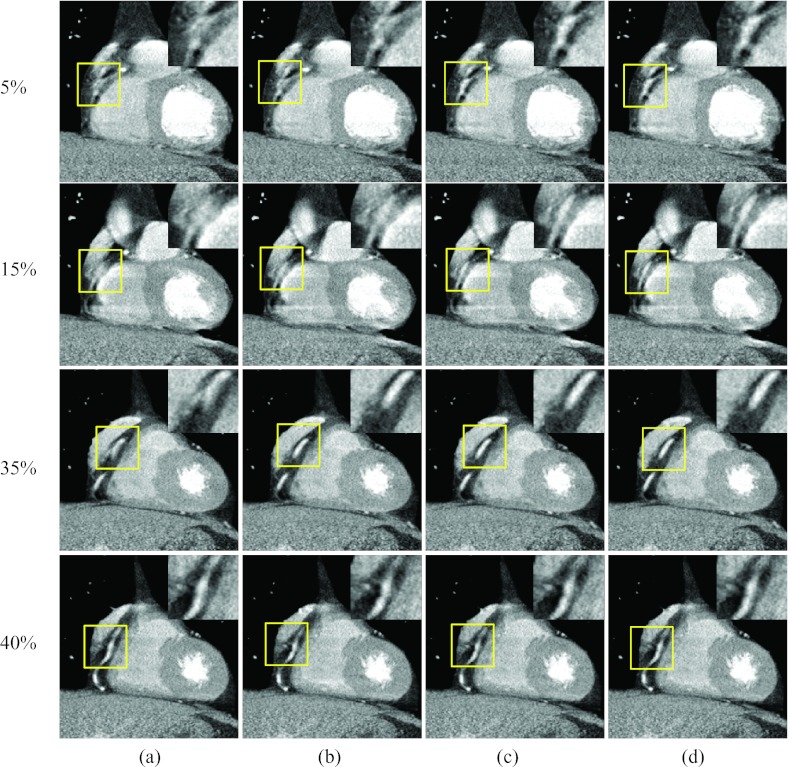
Figure 5 shows images of two rapid phases (15% and 35% R-R) and the corresponding reference phases at 5% and 40% R-R, reconstructed without motion compensation and with the proposed method after the 1st, 3rd, and 9th iteration. The motion artifacts near the RCA were substantially decreased with the proposed method, and the degree of improvement increased with the number of iteration steps, especially at phases 5% and 15%. This shows that the proposed method can improve the image quality, even if the reference image (phase 5%) is degraded by minor or moderate motion artifacts. The improvement in motion blurriness was also investigated for regions other than the RCA. The circled region in Fig. 5 for phase 35% R-R includes the left ventricle and the right atrium. The boundary between these two chambers was severely blurred without motion compensation [Fig. 5a], while it could be clearly depicted in the images obtained with the proposed algorithm [Fig. 5d]. Figure 6 shows coronal images that correspond to Fig. 5, and demonstrates the same level of reduction of motion artifacts with the proposed method.
Figure 5.
Reconstructed axial images of patient 1: Column (a) was reconstructed without motion compensation, and columns (b)–(d) were obtained after the 1, 3, and 9 ME-MCR iterations, respectively. The insets magnify the region indicated by the solid box. The window width and level were 500 HU and 50 HU. The same window-level setting is used in the following figures unless noted otherwise.
Figure 6.
Reconstructed coronal images of patient 1. The insets magnify the region indicated by the solid box (right coronary region). The 16-panel format is the same as in Fig. 5.
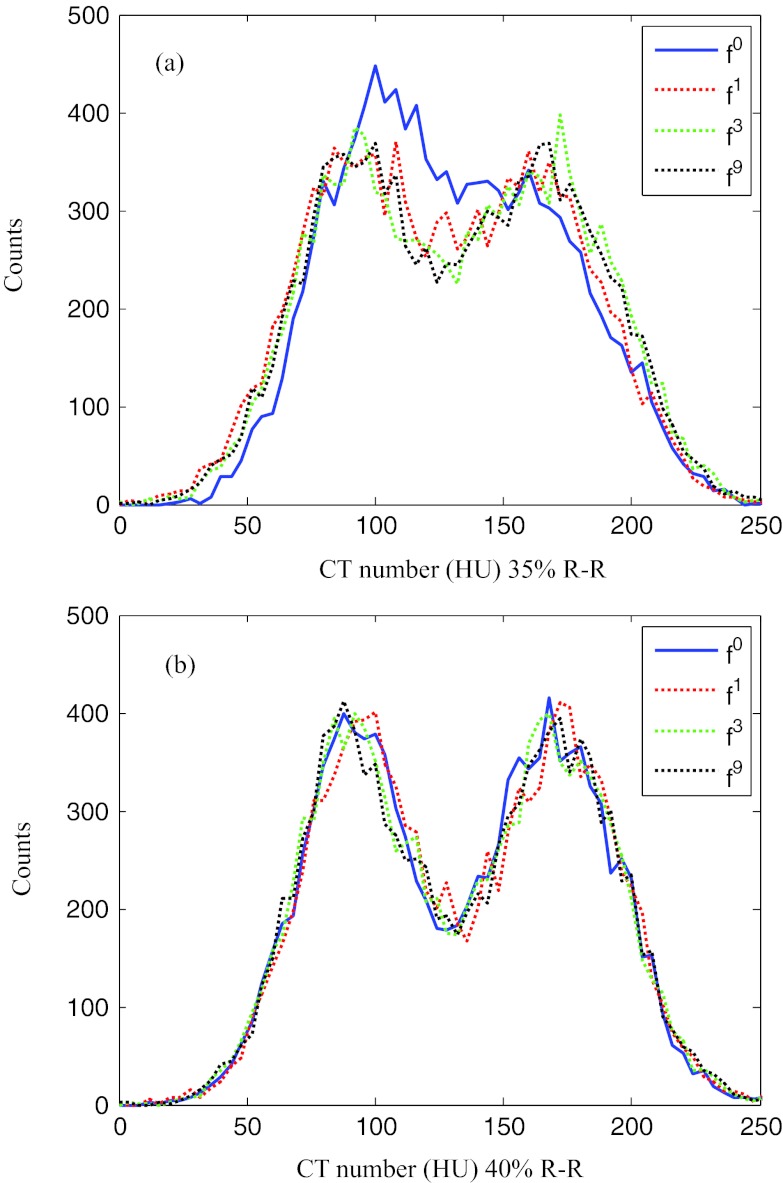
A quantitative evaluation of the improvement in image quality was performed using the transition region indicated by the dotted rectangle in Fig. 5 for 35% and 40% R-R. The region enclosed an area between the interventricular septum and the right ventricle and hence contained two different tissue types. The pixel values for the septum were around 90 HU. The blood in the right ventricle was weakly enhanced due to contrast agent with pixel values around 170 HU. Figure 7 shows histograms of the pixel values in this transition region for images reconstructed without motion compensation and with motion compensation after the 1st, 3rd, and 9th iteration. At the quiet reference phase (40% R-R), the distribution of the pixel values is separated into two distinct peaks. The motion-compensated reconstruction does not improve the sharpness of the separation. However, at the rapid phase 35% R-R without motion compensation the boundary between septum and right ventricle is blurred which is reflected in a single broad peak of the pixel value distribution. The proposed algorithm restored the separation between these two tissue types, yielding an increasingly sharper boundary. After nine iterations the two peaks in the pixel value distribution were separated similar to those at the quiet phase. For this particular evaluation, the standard deviations (STDs) of the pixel value distributions could be used as a quantitative indicator for the separation of the two peaks and are listed in Table 2. The STD at 35% R-R increased with the number of MC-MCR iterations and after nine iterations it was similar to the STD value at the reference phase 40% R-R.
Figure 7.
Histograms of the CT numbers in the rectangular region in Fig. 5 for phase 35% R-R (a) and for phase 40% R-R (b) after 0, 1, 3, and 9 ME-MCR iterations.
Table 2.
Standard deviation (STD) of the pixel values in the rectangle region of Fig. 5 and steepness of the boundary along the profiles in Fig. 8. The values were calculated at phases 35% and 40% R-R without MCR and after 1, 3, and 9 ME-MCR iterations.
| STD (HU) |
Steepness (HU/pixel) |
|||
|---|---|---|---|---|
| Iterations | 35% R-R | 40% R-R | 35% R-R | 40% R-R |
| Without MCR | 41.54 | 46.44 | 6.82 | 13.13 |
| 1st iteration | 45.52 | 46.76 | 11.10 | 13.10 |
| 3rd iteration | 46.41 | 47.12 | 11.31 | 13.83 |
| 9th iteration | 46.62 | 47.41 | 11.49 | 13.93 |
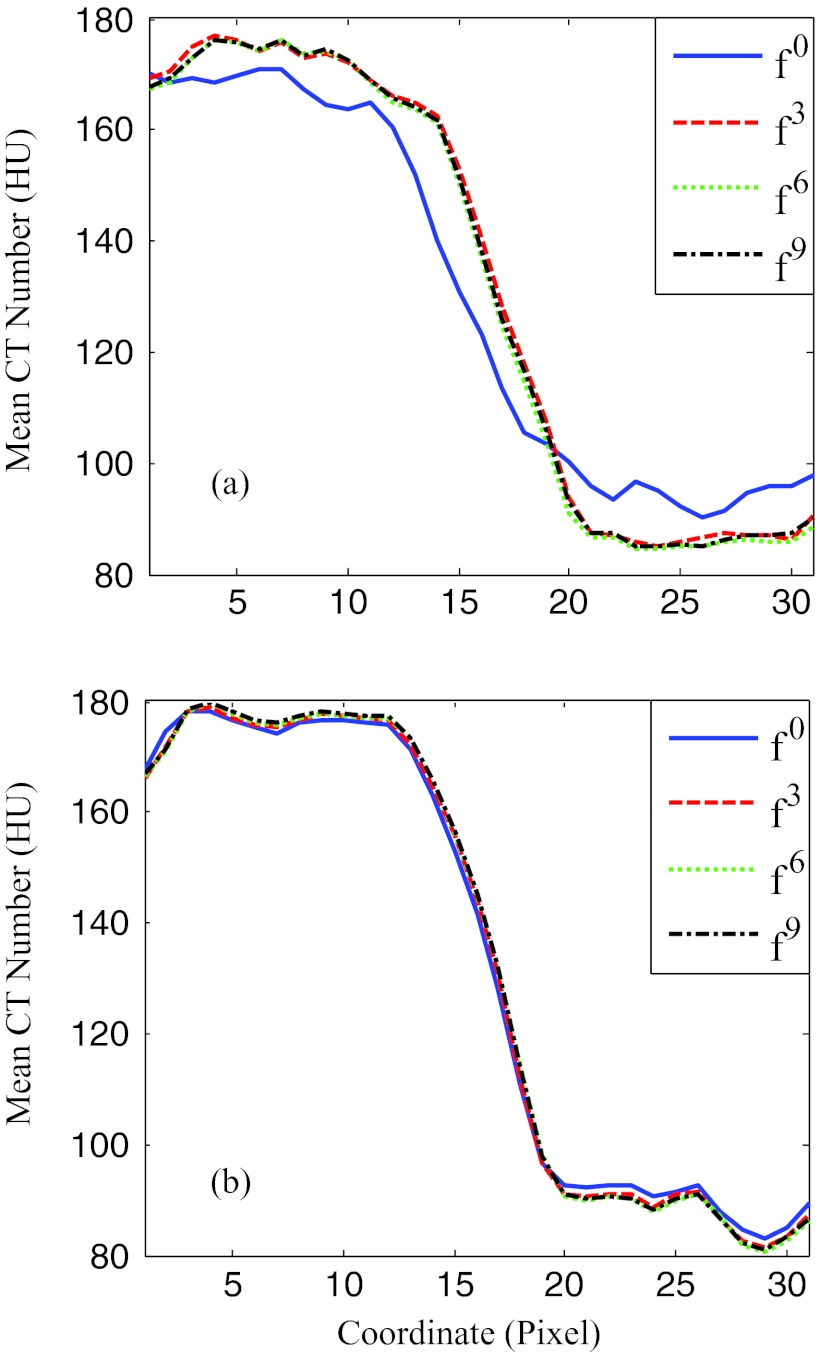
The sharpness of the boundary between septum and right ventricle is visualized in Fig. 8 by plotting the profile of the pixel values along the short side of the dotted rectangle in Fig. 5. For the reference phase, the profiles are almost identical for all iteration steps. For the rapid phase at 35% R-R, the steepness of the profile in the transition region increased to 11.5 HU/pixel using the ME-MCR method compared to 6.8 HU/pixel without motion compensation (see Table 2).
Figure 8.
Profiles of the rectangle region indicated in Fig. 5. (a) and (b) correspond to phases 35% and 40% R-R, respectively. The x-coordinate points along the short side of the rectangles in Fig. 5. The y-coordinate is the mean pixel value along the long side of the rectangles. The solid, dashed, dotted, and dashed-dotted lines correspond to 0, 1, 3, and 9 ME-MCR iterations.
A case with three clear reference phases (patient 2)
Figure 9 shows the MAD between the images at the current and the previous iterations separately for each cardiac phase. The MAD values decreased for all cardiac phases, although the degree of improvement depended on the phase.
Figure 9.
Mean absolute difference varying with iteration number and cardiac phase for patient 2.
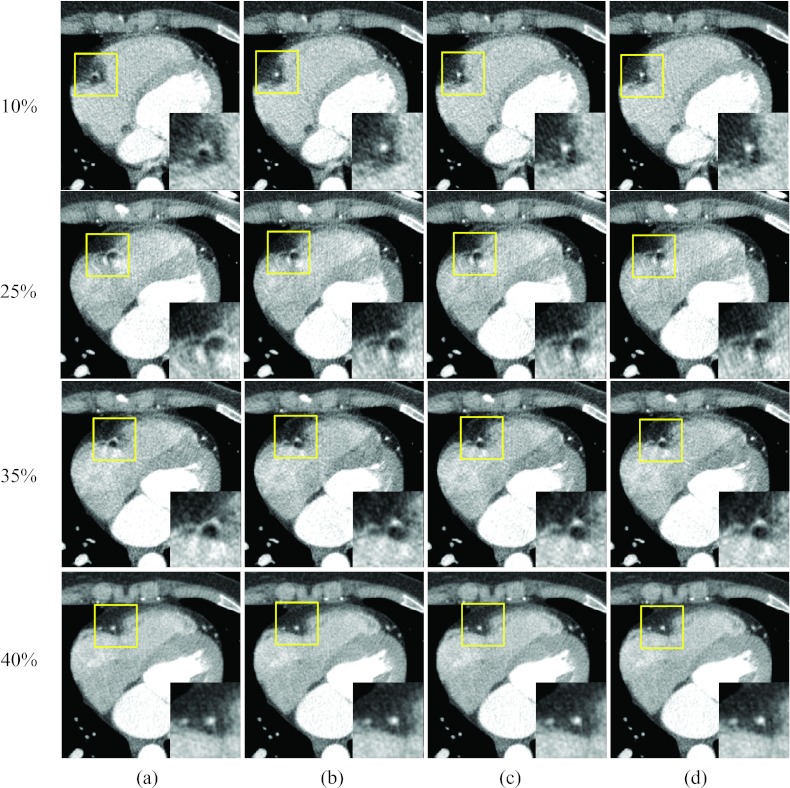
Figure 10 shows axial images at three rapid phases 10%, 25%, and 35% R-R and one quiescent phase 40% R-R, reconstructed without motion compensation and by the proposed method. The RCA appeared as a bright dot at the quiescent phase but was deformed into an arc due to motion at the rapid phases [column (a)]. After one ME-MCR iteration, the RCA appeared as a clear dot at phases 10% and 35% R-R and the deformation was reduced at phase 25% R-R [column (b)]. The MCR image at phase 40% R-R was as clear as the one without motion compensation. The blurring artifacts were reduced by the proposed method without degrading the image quality at the quiescent phase.
Figure 10.
Reconstructed axial images of patient 2. Column (a) was reconstructed without motion compensation, and columns (b)–(d) were obtained after 1, 3, and 9 ME-MCR iterations. Three fast motion phases 10%, 25%, and 35% R-R and one quiescent phase 40% R-R are shown. The insets are the zoom-in of the box (right coronary region).
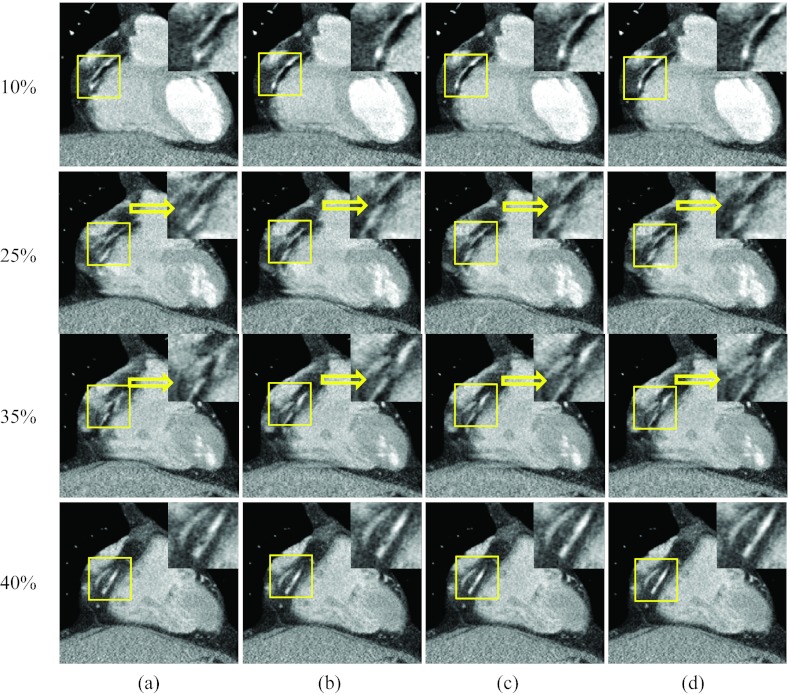
Figure 11 shows coronal images corresponding to Fig. 10. The RCA in column (b) is sharper than in column (a). Due to the nonperiodic heart beat, banding artifacts appeared in the RCA region (discontinuities in column (a), indicated by arrows).
Figure 11.
Reconstructed coronal images of patient 2: The insets were the zoom-in of the box (right coronary region). The 16-panel format is the same as in Fig. 10.
A case with two clear and one blurred reference phases (patient 3)
Figure 12 shows the MAD between the images at the current and the previous iterations separately for each cardiac phase. The MAD values decreased for all cardiac phases.
Figure 12.
Mean absolute difference varying with iteration number and cardiac phase for patient 3.
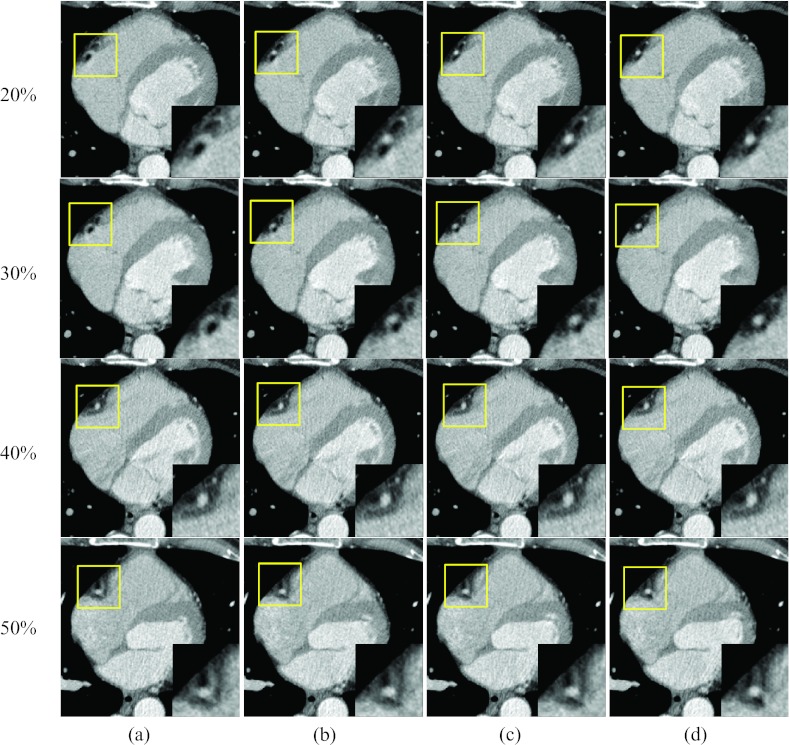
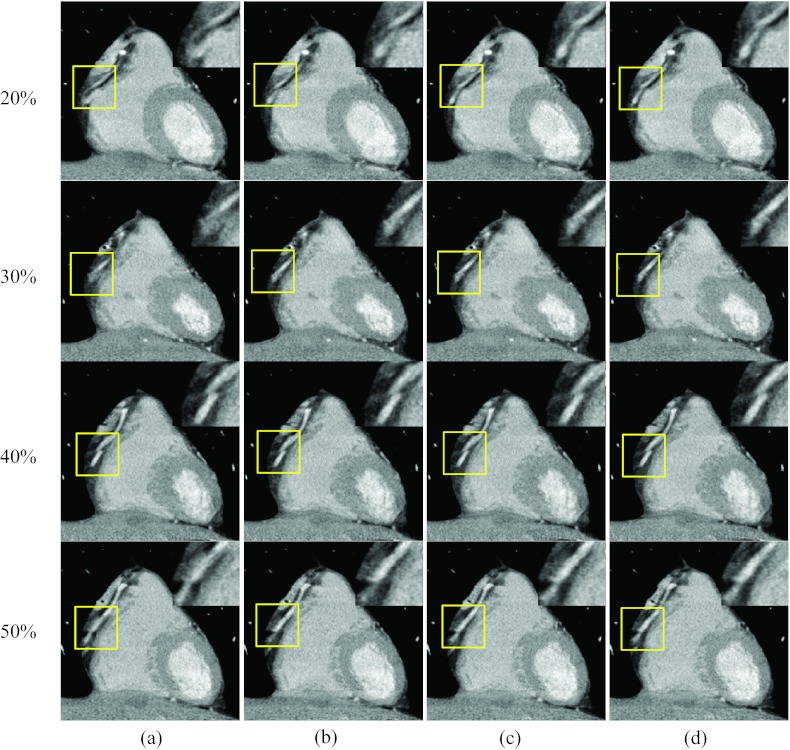
Figures 1314 present results when one reference phase (at end-systole, 40% R-R) was blurred due to cardiac motion. Figure 13 shows the axial images at three rapid phases 20%, 30%, and 50% R-R and the quiescent phase at 40% R-R. Images were reconstructed without motion compensation [column (a)], with one ME-MCR iteration loop [column (b)], with three ME-MCR iteration loops [column (c)] and nine ME-MCR iteration loops [column (d)]. The images in column (c) have fewer motion artifacts than those in columns (a) and (b), indicating the effectiveness of the proposed ME-MCR method even if the reference image used for ME is blurred. The sharpness of the RCA in the images at the quiescent reference was not changed during ME-MCR. Figure 14 shows coronal images corresponding to Fig. 13. The sharpness (along the longitudinal direction) of the RCA kept improving as the ME-MCR iteration progressed.
Figure 13.
Reconstructed axial images of patient 3. Columns (a) was reconstructed without motion compensation, (b)–(d) were obtained after the 1, 3, and 9 ME-MCR iterations, respectively. Three fast motion phases 20%, 30%, and 50% R-R and one quiescent reference phase 40% R-R are shown. The insets are the zoom-in of the box (right coronary region).
Figure 14.
Reconstructed coronary images of patient 3: The insets are the zoom-in of the box (right coronary region). The 16-panel format is the same as in Fig. 13.
A case with three blurred reference phases (patient 4)
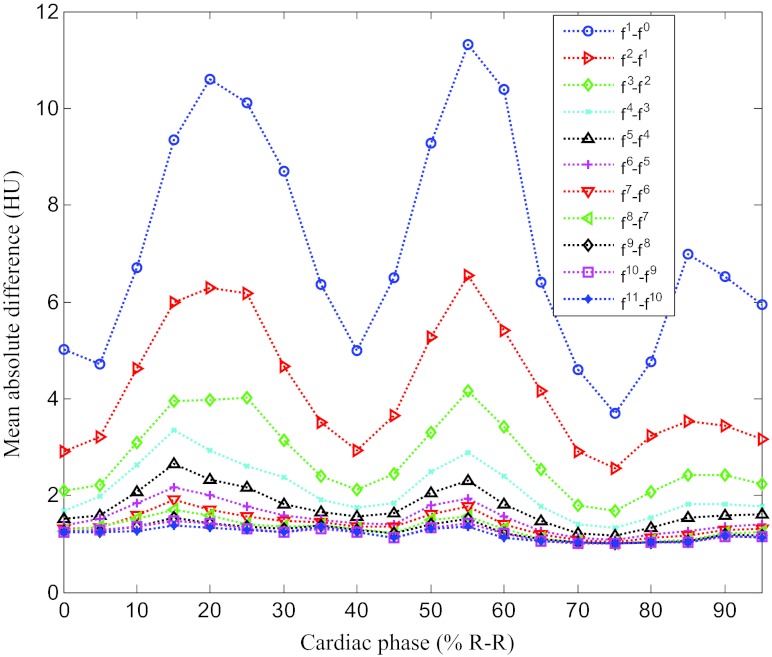
Figure 15 shows the MAD between the images at the current and the previous iterations separately for each cardiac phase. The MAD values decreased for all cardiac phases similar to the other three cases.
Figure 15.
Mean absolute difference varying with iteration number and cardiac phase for patient 4.
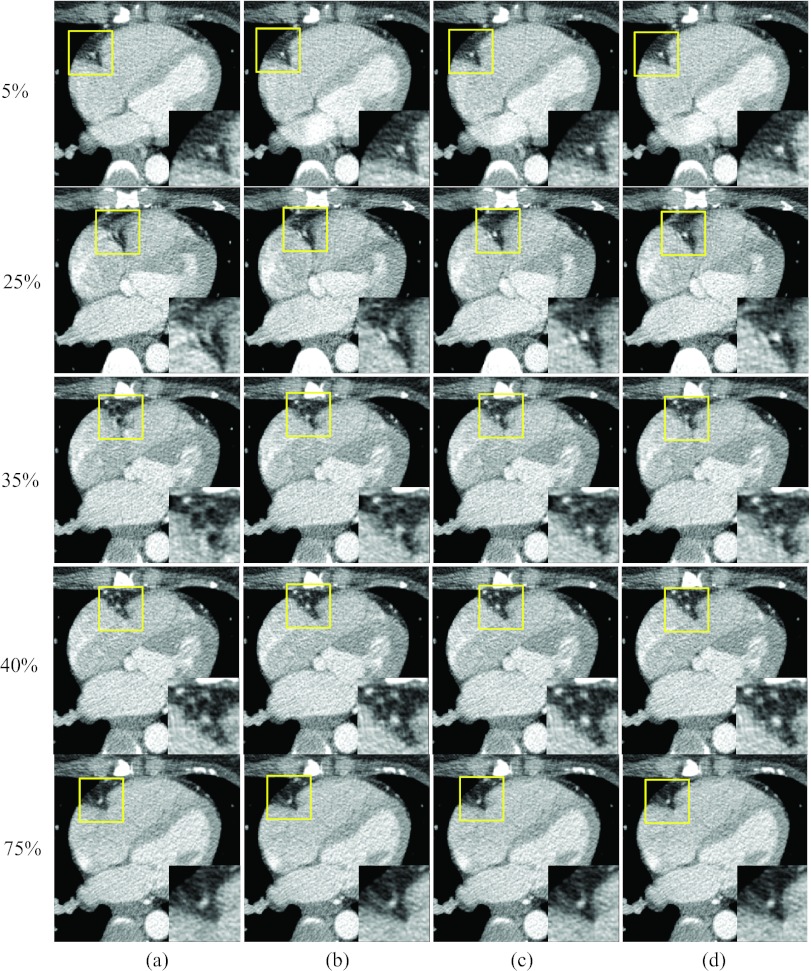
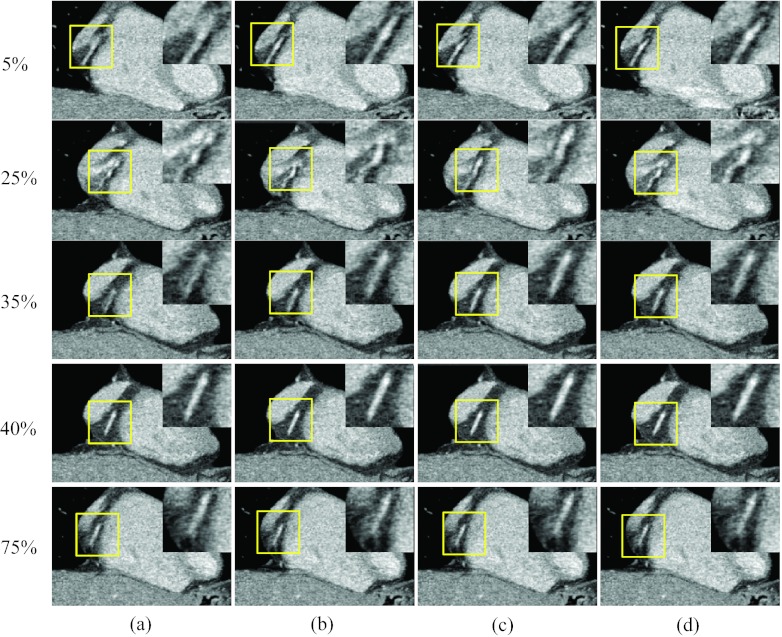
Figures 1617 show results when all three reference phases are affected by motion artifacts due to a more rapid heart rate. Figure 16 shows axial images at three rapid phases 25% and 35% R-R and the quiescent phase 5%, 40%, and 75% R-R, reconstructed without motion compensation [column (a)], after one ME-MCR iteration [column (b)], after three ME-MCR iterations [column (c)] and nine ME-MCR iterations [column (d)]. Images reconstructed after three iterations show fewer motion artifacts than those obtained with only one iteration loop. The image quality at the reference phases 5%, 40%, and 75% R-R was also improved. Figure 17 shows coronal images corresponding to Fig. 16. The sharpness along the short axis direction of the RCA improved with ME-MCR.
Figure 16.
Reconstructed axial images of patient 4: Column (a) was reconstructed without motion compensation, and columns (b)–(d) were obtained after the 1, 3, and 9 ME-MCR iterations, respectively. Two fast motion phases 25% and 35% R-R and three reference phases 5%, 40%, and 75% R-R are shown. The insets are the zoom-in of the box (right coronary region).
Figure 17.
Reconstructed coronal image of patient 4: The insets were the zoom-in of the box (right coronary region). The 20-panel format is the same as in Fig. 16.
DISCUSSIONS AND CONCLUSIONS
We developed a fully four-dimensional image reconstruction method that alternates ME and MCR algorithms in an iterative fashion. The ME method estimated cardiac MVFs using nonrigid image registration between reference phases and all other phases. The MCR method reconstructed cardiac images using the MVFs estimated by the ME method. Those images were the input to the ME in the next iteration. The ME and MCR were performed alternately until convergence was achieved.
The performance of the proposed method was evaluated on clinical data from four patients. These four cases represented a wide spectrum of difficulty for the motion estimation algorithm due to different levels of motion artifacts at the three quiescent reference phases at end-systole, mid-diastole, and end-diastole. The motion artifacts at rapid phases were reduced significantly in all cases with the proposed method. This also indicates that the MVFs obtained by the ME were sufficiently accurate. The motion blurring at the reference phases in the moderate and difficult cases was also suppressed. This indicates that the proposed algorithm does not require motion-free reference phases and that it can improve the image quality of the reference phases as well. Consequently, the ME-MCR algorithm is beneficial in clinical situations even if the images at quiescent phases are affected by motion artifacts. However, if the reference image suffers from severe motion artifacts, especially in the case where there is no cardiac phase with acceptable image quality that can serve as a reference phase, it is difficult to improve the image quality by the proposed method. This is the limitation of the proposed method. Also, the proposed method, which assumes a regular heart motion, will not reduce cardiac banding artifacts24, 28 caused by irregular heart motion. One would have to incorporate a scheme to overcome such irregularity into a motion estimation method such as Rohkohl et al. proposed.29, 30
The results show that the reduction of motion artifacts improved with more iteration steps. This indicates the stability of the approach despite the fact that the two methods, ME and MCR, are only loosely coupled and are not connected by a common cost function. We hypothesize that the gradually improved images result in more accurate MVFs in the next iteration step, which in turn lead to reduced motion artifacts. A theoretical and qualitative investigation of this hypothesis is the subject of a future study. An advantage of the decoupled approach is that both parts of the ME-MCR method can be modified independently. A disadvantage, however, is that each part depends solely on improvements by the other part.
It was shown empirically that the use of MCR improved artifacts even if the MVFs were not completely accurate, for example, if the initial reference phases were blurred. This confirms the hypothesis that MCR with slightly inaccurate MVFs should still result in better images than using no motion information at all—as long as the MVFs are reasonable.
The results are encouraging toward our ultimate goals: improvement of temporal resolution, image noise, or radiation dose reduction. The improved image quality indicates that the effective temporal resolution was increased. By using current protocols but a larger range of projection data for reconstruction, the proposed method may improve the noise (or the signal-to-noise ratio) while keeping sharpness and motion artifacts at a level comparable to current reconstruction methods. Consequently, a lower tube current could be used together with a larger projection range to reconstruct images at any cardiac of phase of interest with a signal-to-noise ratio comparable to current techniques and protocols. Results of such studies will be presented in a future publication.
The proposed ME-MCR algorithm has some room for improvement: Motion artifacts remained present in some phases, especially when the heart rate was high and the motion was rapid. Candidates to advance the ME include methods to improve modeling the cardiac motion, for example, using a denser knot distribution or a different regularization. A scheme to overcome the effect of motion artifacts may be helpful as well. The use of projection data as a similarity measure instead of image data may be useful, although computationally expensive. The MCR could be improved further by using techniques that compensate more accurately for a larger class of deformations.18
Recently, the use of statistical methods in image reconstruction has received increasing attention in the CT community. A sinogram restoration approach31, 32 with the proposed ME-MCR method is trivial, while the use of fully iterative statistical reconstruction is a challenge. We acknowledge that the best performance could be achieved if all of the physics and object deformations were modeled accurately. However, we postulate that such an algorithm would be computationally too expensive for current hardware architectures and may not converge in a stable and robust way because of the larger number of unknowns (both pixel values and their temporal change). The estimation of these two types of unknowns, if alternated, may overcompensate and oscillate if the models are not accurate. It is known that even small data inconsistencies can lead to shading artifacts when using iterative reconstruction.19
In conclusion, we developed a fully 4D image reconstruction method that alternates ME and MCR algorithms in an iterative fashion. Performance tests using clinical patient data resulted in reduced motion artifacts.
ACKNOWLEDGMENTS
This work was supported in part by National Institutes of Health (NIH) Grant Nos. R01 HL087918 and R01 HL087918A2S1, American Heart Association Grant No. 0865315E, and Siemens Grant No. JHU-2011-CT-61-01. We thank Elliot K. Fishman, M.D., for providing clinical data and for valuable discussion. We appreciate Meiyappan Solaiyappan, Ph.D., Arkadiusz Sitek, Ph.D., and Martin Stumpf, M.Sc. for their help with GPU implementation, and Danny Ruijters for his CUDA Cubic B-Spline interpolation library.
References
- Hsieh J., Londt J., Vass M., Li J., Tang X., and Okerlund D., “Step-and-shoot data acquisition and reconstruction for cardiac x-ray computed tomography,” Med. Phys. 33, 4236–4248 (2006). 10.1118/1.2361078 [DOI] [PubMed] [Google Scholar]
- Stolzmann P., Leschka S., Scheffel H., Krauss T., Desbiolles L., Plass A., Genoni M., Flohr G. T., Wildermuth S., Marincek B., and Alkadhi H., “Dual-source CT in step-and-shoot mode: Noninvasive coronary angiography with low radiation dose,” Radiology 249, 71–80 (2008). 10.1148/radiol.2483072032 [DOI] [PubMed] [Google Scholar]
- Weustink A. C., Neefjes L. A., Kyrzopoulos S., van Straten M., Neoh Eu R., Meijboom W. B., van Mieghem C. A., Capuano E., Dijkshoorn M. L., Cademartiri F., Boersma E., de Feyter P. J., Krestin G. P., and Mollet N. R., “Impact of heart rate frequency and variability on radiation exposure, image quality, and diagnostic performance in dual-source spiral CT coronary angiography,” Radiology 253, 672–680 (2009). 10.1148/radiol.2533090358 [DOI] [PubMed] [Google Scholar]
- Flohr T. G., McCollough C. H., Bruder H., Petersilka M., Gruber K., Süß C., Grasruck M., Stierstorfer K., Krauss B., Raupach R., Primak A. N., Küttner A., Achenbach S., Becker C., Kopp A., and Ohnesorge B. M., “First performance evaluation of a dual-source CT (DSCT) system,” Eur. Radiol. 16,256–268 (2006). 10.1007/s00330-005-2919-2 [DOI] [PubMed] [Google Scholar]
- Blondel C., Vaillant R., Malandain G., and Ayache N., “3D tomographic reconstruction of coronary arteries using a precomputed 4D motion field,” Phys. Med. Biol. 49, 2197–2208 (2004). 10.1088/0031-9155/49/11/006 [DOI] [PubMed] [Google Scholar]
- Schäfer D., Borget J., Rasche V., and Grass M., “Motion-compensated and gated cone beam filtered back-projection for 3-D rotational x-ray angiography,” IEEE Trans. Med. Imaging 25, 898–906 (2006). 10.1109/TMI.2006.876147 [DOI] [PubMed] [Google Scholar]
- Li T., Schreibmann E., Yang Y., and Xing L., “Motion correction for improved target localization with on-board cone-beam computed tomography,” Phys. Med. Biol. 51, 253–267 (2006). 10.1088/0031-9155/51/2/005 [DOI] [PubMed] [Google Scholar]
- van Stevendaal U., von Berg J., Lorenz C., and Grass M., “A motion-compensated scheme for helical cone-beam reconstruction in cardiac CT angiography,” Med. Phys. 35, 3239–3251 (2008). 10.1118/1.2938733 [DOI] [PubMed] [Google Scholar]
- Isola A. A., Ziegler A., Koehler T., Niessen W. J., and Grass M., “Motion-compensated iterative cone-beam CT image reconstruction with adapted blobs as basis functions,” Phys. Med. Biol. 53, 6777–6797 (2008). 10.1088/0031-9155/53/23/009 [DOI] [PubMed] [Google Scholar]
- Schirra C. O., Bontus C., van Stevendaal U., Dössel O., and Grass M., “Improvement of cardiac CT reconstruction using local motion vector fields,” Comput. Med. Imaging Graph. 33, 122–130 (2009). 10.1016/j.compmedimag.2008.10.012 [DOI] [PubMed] [Google Scholar]
- Prümmer M., Hornegger J., Lauritsch G., Wigström L., Girard-Hughes E., and Fahrig R., “Cardiac C-arm CT: A unified framework for motion estimation and dynamic CT,” IEEE Trans. Med. Imaging 28, 1836–1849 (2009). 10.1109/TMI.2009.2025499 [DOI] [PubMed] [Google Scholar]
- Isola A. A., Grass M., and Niessen W. J., “Fully automatic nonrigid registration-based local motion estimation for motion-corrected iterative cardiac CT reconstruction,” Med. Phys. 37, 1093–1109 (2010). 10.1118/1.3301600 [DOI] [PubMed] [Google Scholar]
- Isola A. A., Schmitt H., van Stevendaal U., Begemann P. G., Coulon P., Boussel L., and Grass M., “Image registration and analysis for quantitative myocardial perfusion: Application to dynamic circular cardiac CT,” Phys. Med. Biol. 56, 5925–5947 (2011). 10.1088/0031-9155/56/18/010 [DOI] [PubMed] [Google Scholar]
- Tang Q., Cammin J., Srivastava S., and Taguchi K., “Non-rigid, four-dimensional motion estimation for cardiac CT,” Med. Phys. (submitted). [DOI] [PMC free article] [PubMed]
- Crawford C. R., King K. F., Ritchie C. J., and Godwin J. D., “Respiratory compensation in projection imaging using a magnification and displacement model,” IEEE Trans. Med. Imaging 15(3), 327–332 (1996). 10.1109/42.500141 [DOI] [PubMed] [Google Scholar]
- Ritchie C. J., Crawford C. R., Godwin J. D., King K. F., and Kim Y., “Correction of computed tomography motion artifacts using specific back-projection,” IEEE Trans. Med. Imaging 15(3), 333–342 (1996). 10.1109/42.500142 [DOI] [PubMed] [Google Scholar]
- Desbat L., Roux S., and Grangeat P., “Compensation of some time dependent deformations in tomography,” IEEE Trans. Med. Imaging 26(2), 261–269 (2007). 10.1109/TMI.2006.889743 [DOI] [PubMed] [Google Scholar]
- Taguchi K. and Kudo H., “Motion compensated fan-beam reconstruction for nonrigid transformation,” IEEE Trans. Med. Imaging 27(7), 907–917 (2008). 10.1109/TMI.2008.925076 [DOI] [PubMed] [Google Scholar]
- Zeng K., De Man B., and Thibault J. B., “Correction of iterative reconstruction artifacts in helical cone-beam CT,” in Proceedings of the 10th International Conference on Fully Three-Dimensional Reconstruction in Radiology and Nuclear Medicine (Beijing, China, 2009), pp. 242–245.
- Zeng R., Fessler J. A., and Balter J. M., “Respiratory motion estimation from slowly rotating x-ray projections: Theory and simulation,” Med. Phys. 32(4), 984–991 (2005). 10.1118/1.1879132 [DOI] [PubMed] [Google Scholar]
- Parker D. L., “Optimal short scan convolution reconstruction for fan-beam CT,” Med. Phys. 9, 254–257 (1982). 10.1118/1.595078 [DOI] [PubMed] [Google Scholar]
- Taguchi K. and Kudo H., “A simple motion tracking backprojection for a class of affine transformation,” in Proceedings of SPIE Medical Imaging (SPIE, San Diego, 2008), pp. 69131V-1-69131V-8.
- Feldkamp L. A., Davis L. C., and Kress J. W., “Practical cone-beam algorithm,” J. Opt. Soc. Am. A 1, 612–619 (1984). 10.1364/JOSAA.1.000612 [DOI] [Google Scholar]
- Taguchi K., Chiang B. S., and Hein I. A., “Direct cone-beam cardiac reconstruction algorithm with a cardiac banding artifact correction,” Med. Phys. 33, 521–539 (2006). 10.1118/1.2163247 [DOI] [PubMed] [Google Scholar]
- Chen M., Lu W., Chen Q., Ruchala K. J., and Olivera G. H., “A simple fixed-point approach to invert a deformation field,” Med. Phys. 35(1), 81–88 (2008). 10.1118/1.2816107 [DOI] [PubMed] [Google Scholar]
- Gilland D. R., Mair B. A., Bowsher J. E., and Jaszczak R. J., “Simultaneous reconstruction and motion estimation for gated cardiac ECT,” IEEE Trans. Nucl. Sci. 49, 2344–2349 (2002). 10.1109/TNS.2002.803820 [DOI] [Google Scholar]
- Gilland D. R., Mair B. A., and Sun J. J., “4D reconstruction and motion estimation in gated cardiac ECT,” in Proceedings of the 8th International Conference on Fully Three-Dimensional Reconstruction in Radiology and Nuclear Medicine, edited by Noo F., Zeng G. L., and Kudo H. (Salt Lake City, UT, 2005), pp. 303–306.
- Hoffmann M. H. K., Shi H., Manzke R., Schmid F. T., De Vries L., Grass M., Brambs H., and Aschoff A. J., “Noninvasive coronary angiogra-phy with 16-detector row CT: Effect of heart rate,” Radiology 234, 86–97 (2005). 10.1148/radiol.2341031408 [DOI] [PubMed] [Google Scholar]
- Rohkohl C., Lauritsch G., Prümmer M., and Hornegger J., “Interventional 4-D motion estimation and reconstruction of cardiac vasculature without motion periodicity assumption,” in Medical Image Computing and Computer-Assisted Intervention–MICCAI (Springer, London, UK, 2009), pp. 132–139. [DOI] [PubMed] [Google Scholar]
- Rohkohl C., Lauritsch G., Prümmer M., and Hornegger J., “Towards 4-D cardiac reconstruction without ECG and motion periodicity using C-arm CT,” in Proceedings of the 10th International Conference on Fully Three-Dimensional Reconstruction in Radiology and Nuclear Medicine (Beijing, China, 2009), pp. 323–326.
- La Rivière P. J., “Penalized-likelihood sinogram smoothing for low-dose CT,” Med. Phys. 32(6), 1676–1683 (2005). 10.1118/1.1915015 [DOI] [PubMed] [Google Scholar]
- La Rivière P. J., Bian J., and Vargas P. A., “Penalized-likelihood sinogram restoration for computed tomography,” IEEE Trans. Med. Imaging 25(8), 1022–1036 (2006). 10.1109/TMI.2006.875429 [DOI] [PubMed] [Google Scholar]


