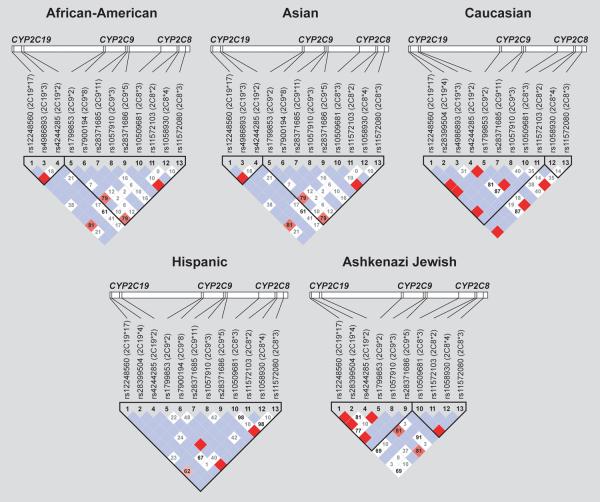
FIGURE 1.
Linkage disequilibrium (LD) across the CYP2C locus (10q23.33) in each tested population using 13 polymorphic SNPs. Pairwise LD between polymorphisms is expressed as D'. Significant linkage (logarithm of the odds, LOD≥2) is illustrated by red shading depending on the magnitude of D' (from pink to bright red), and insignificant linkage (LOD<2) is illustrated by blue (if D'=1) or white (if D'<1) shading. Haplotype blocks were inferred using the `Four gamete of LD' method (Haploview).

