Fig. 3.
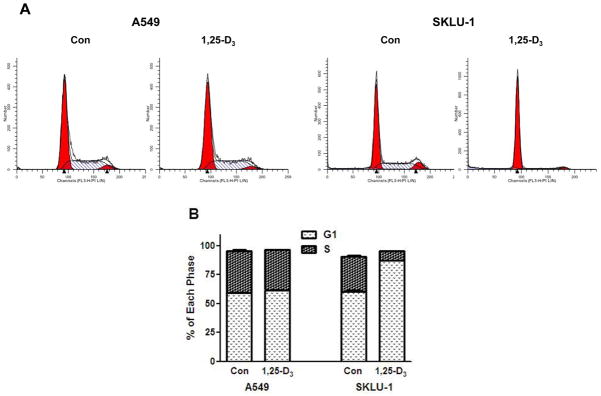
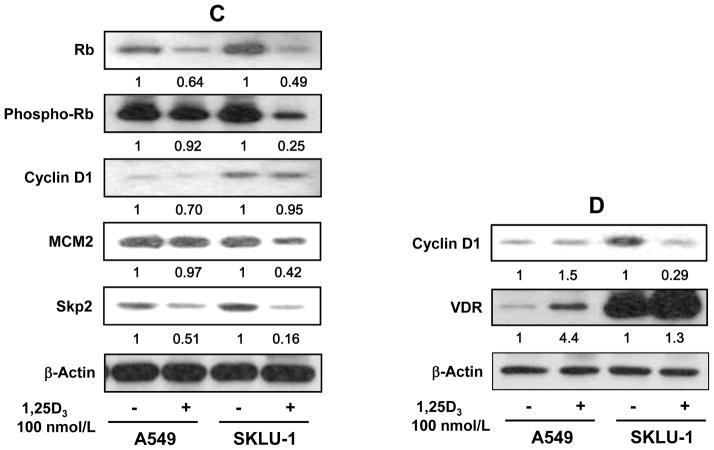
FACScan analysis and immunoblot analysis in human lung cancer cell lines. A549 and SKLU-1 cells were treated with 100 nmol/L of 1,25-dihydroxyvitamin D3 (1,25-D3) for 72 h. A, representative flow cytometry data showed 1,25-D3 induced G1/S arrest in SKLU-1 cell. B, changes in the distribution of cells in G1 and S phase following treatment with 1,25-D3. Results are expressed as mean ± standard deviation (SD) of 3 replicates of the percentage of cells in the different phases of the cell cycle. This was repeated three times. C, total protein expression of retinoblastoma (Rb), phospho-Rb, cyclin D1, S-phase kinase protein 2 (Skp2) and minichromosome maintenance 2 (MCM2), markers of cells entering S-phase, in high (SKLU-1) and low (A549) vitamin D receptor (VDR) mRNA expressing lung adenocarcinoma (AC) cell lines. The total protein expression of Rb, phospho-Rb, Skp2 and MCM2 significantly decreased by 1,25-D3 in SKLU-1 cells compared to A549 cells. Minimal changes of cyclin D1 from total protein were shown in both A549 and SKLU-1 cells. D, nuclear protein expression of cyclin D1 and VDR in A549 and SKLU-1 cells. Nuclear protein expression of cyclin D1 was significantly reduced by 1,25-D3 in SKLU-1 cells but no changes were observed in A549 cell with the treatment of 1,25-D3. Each band was normalized by β-actin. Arbitrary units in the figures represent the ratio between the normalized band density of the specific protein treated with 1,25-D3 and the corresponding untreated protein. This was repeated three times independently.


