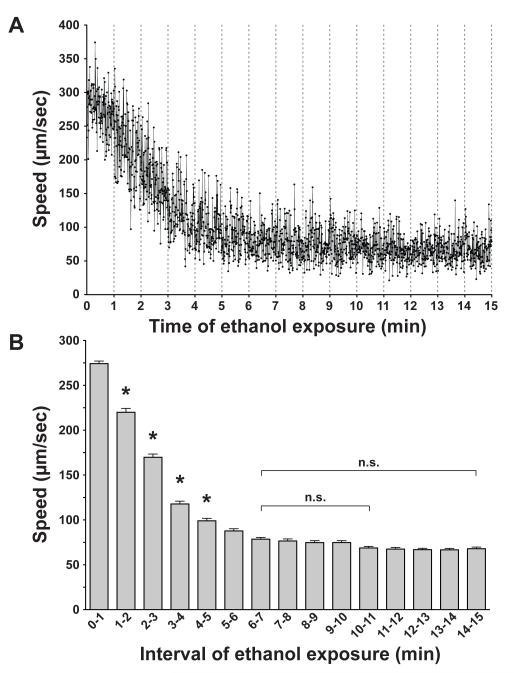
Figure 1. Time course for ethanol effects on speed of locomotion.
(a) The mean speed (μm/sec ± SEM) of young adult wild-type animals (n = 6) exposed to 500 mM exogenous ethanol in the absence of food is shown for every 0.5 seconds over a 15-minute period beginning immediately after ethanol exposure. (b) Speeds within each minute of ethanol exposure were binned and a mean (n = 120) calculated for each bin. Significant decreases in speed are only seen in the first 5 minutes when each bin is compared with the previous bin (*, P < 0.01). Bin 6-7 minutes is not significantly different from any bin that follows. n.s., not significantly different.

